Verification Statistics for Binary Categorical Forecasts
Most meteorological forecasts would be described as non-probabilistic, meaning the forecast value given is provided with no additional information of certainty in that value. Another term for this type of forecast is deterministic and will be the focus of the verification statistics in this section. For more information on probabilistic forecasts and their corresponding statistics please refer to the probabilistic section. When verifying binary categorical forecasts, the only important factor is whether or not the event occurred: the assumed certainty in the forecast is 100%.
Numerous computationally-easy (and very popular) scalar statistics are within reach without too much manipulation of a contingency table’s counts.
Accuracy (Acc)
The scalar attribute of Accuracy is measured as a simple ratio between the forecasts that correctly predicted the event and the total number of occurrences and non-occurrences, n. In equation format,
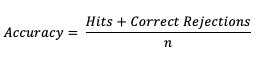
This measure (often called “Percent Correct”) is very easily computed and addresses how often a forecast is correctly predicting an event and non-event. As most verification resources will warn you, however, this measure should be used with caution, especially for an event that happens only rarely. The Finley tornado forecast study (1884) is an excellent example of the need for caution, with Finley reporting a 96.6% Accuracy for predicting a tornado due to the overwhelming count of correct negatives. Peers were quick to point out that a higher Accuracy (98.2%) could have been achieved with a persistence forecast of No Tornado! See how to use this statistic in METplus!
Probability of Detection (POD)
Probability of Detection (POD), also referred to as the Hit Rate, measures the frequency that the forecasts were correct given that the forecast predicts an occurrence. Rather than computing the ratio of the correct forecasts to the entire occurrence and non-occurrence count (i.e., as in Accuracy), POD only focuses on the times the forecast predicted an event would occur. Thus, this measure is categorized as a discrimination statistic. POD is computed as
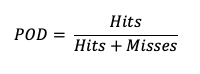
This measure is useful for rare events (tornadoes, 100-year floods, etc.) as it will penalize (i.e. go toward 0) the forecasts when there are too many missed forecasts. See how to use this statistic in METplus!
Probability of False Detection (POFD)
A countermeasure to POD is the probability of false detection (POFD). POFD (also called false alarm rate), measures the frequency of false alarm forecasts relative to the frequency that an event does not occur.
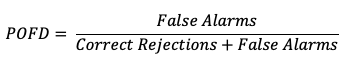
Together, POD and POFD measure forecasts’ ability to discriminate between occurrences and non-occurrences of the event of interest. See how to use this statistic in METplus!
Frequency bias (Bias)
Frequency bias (a measure of, you guessed it, bias!) compares the count of “yes” forecasts to the count of “yes” events observed.
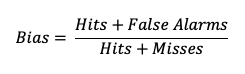
This ratio does not provide specific information about the performance of individual forecasts, but rather is a measure of over- or under-forecasting of the event. See how to use this statistic in METplus!
False Alarm Ratio (FAR)
The False Alarm Ratio (FAR) provides information about both the reliability and resolution attributes of forecasts. It computes the ratio of “yes” forecasts that did not occur to the total number of times a “yes” forecast was made (i.e., the proportion of “yes” forecasts that were incorrect).
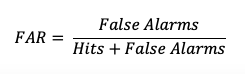
FAR also is the first statistic covered in this session that has a negative orientation: a FAR of 0 is desirable, while a FAR of 1 shows the worst possible ratio of “yes” forecasts that were not observed relative to total “yes” forecasts. See how to use this statistic in METplus!
Critical Success Index (CSI)
The Critical Success Index (CSI), also commonly known as the Threat Score, is a second measure of the overall accuracy of forecasts (e.g., like the Accuracy measure mentioned earlier). Accuracy pertains to the agreement of individual forecast-observation pairs, and CSI can be calculated as
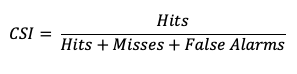
Note that by definition CSI can be described as the ratio between the times the forecast correctly called for an event and the total times the forecast called for an event or the event was observed. Thus, CSI ignores correct negatives, which differentiates it from percent correct. A CSI of 1 indicates a highly accurate forecast, while a value of 0 indicates no accuracy. See how to use this statistic in METplus!