Configuring the METplus OMI use case
The OLR-Based MJO Index (OMI)use case is one of the simplest S2S use cases, so we will start there. First, we will review the python dependencies to make sure these are available. Python dependencies for the OMI Use case we are going to run are listed in the External Dependencies section. For this case, we need to have numpy, netCDF4, datetime, xarray, matplotlib, scipy and pandas available.
This use case also requires the installation and correct environmental settings for METcalcpy and METplotpy. These requirements extend to having both of the respective repositories installed, as well as their corresponding _BASE environmental settings. Assuming that the instructions provided in the METdataio tutorial section have been followed, and the METcalcpy and METplotpy were installed in your ${METPLUS_TUTORIAL_DIR}, set the following commands:
export METDATAIO_BASE=${METPLUS_TUTORIAL_DIR}/metdataio/METdataio
export PYTHONPATH=$METDATAIO_BASE:$METCALCPY_BASE:$METPLOTPY_BASE
The file shows 2 PROCESS_LIST variables, one of which is commented out. The commented out version includes pre-processing steps which can take a long time to run due to the amount of data. Those pre-processing steps create daily means of outgoing longwave radiation (OLR) for the forecast data, and then regrid the observation and model OLR. In this example, we will be omitting those steps, running only the last two steps. The last two steps create a listing of EOF input files and then run the OMI computation.
In this case, creating a listing of EOF files is done in a separate step because the EOF files have different timing information than the input OLR files. Specifically, the EOF input is one file per day of the year, whereas the OMI in this case is computed across 2 years of OLR data. Settings for creating the list of files is given in the [create_eof_filelist] section. The command given in UserScript_COMMAND is irrelevant here as it does not affect the creation of the file lists.
Input variables to the OMI calculation are given in the [user_env_vars] section. The first two variables, OBS_RUN and FCST_RUN are either True or False, and tell the program whether to run model data, observations, or both. The third variable, SCRIPT_OUTPUT_BASE gives the location of the output graphics. The next variable tells the program how many observations per day are in the data. The last set of variables give information about formatting the plotting and output file names.
The information to run the OMI calculation is given in the [script_omi] section. The variables give the frequency of the run time, location of the model and observation input OLR data, the input template labels, which shouldn’t be changed and then the actual command that is run to calculate OMI. Here, the command calls the OMI driver script.
Run METplus for the OMI use case
${METPLUS_BUILD_BASE}/parm/use_cases/model_applications/s2s_mjo/UserScript_fcstGFS_obsERA_OMI.conf \
${METPLUS_TUTORIAL_DIR}/tutorial.conf \
config.OUTPUT_BASE=${METPLUS_TUTORIAL_DIR}/output/met_output/omi
The script should run and if successful, will say:
Check the output
Here you should see three directories (logs, s2s_mjo, and tmp) and the METplus configuration file.
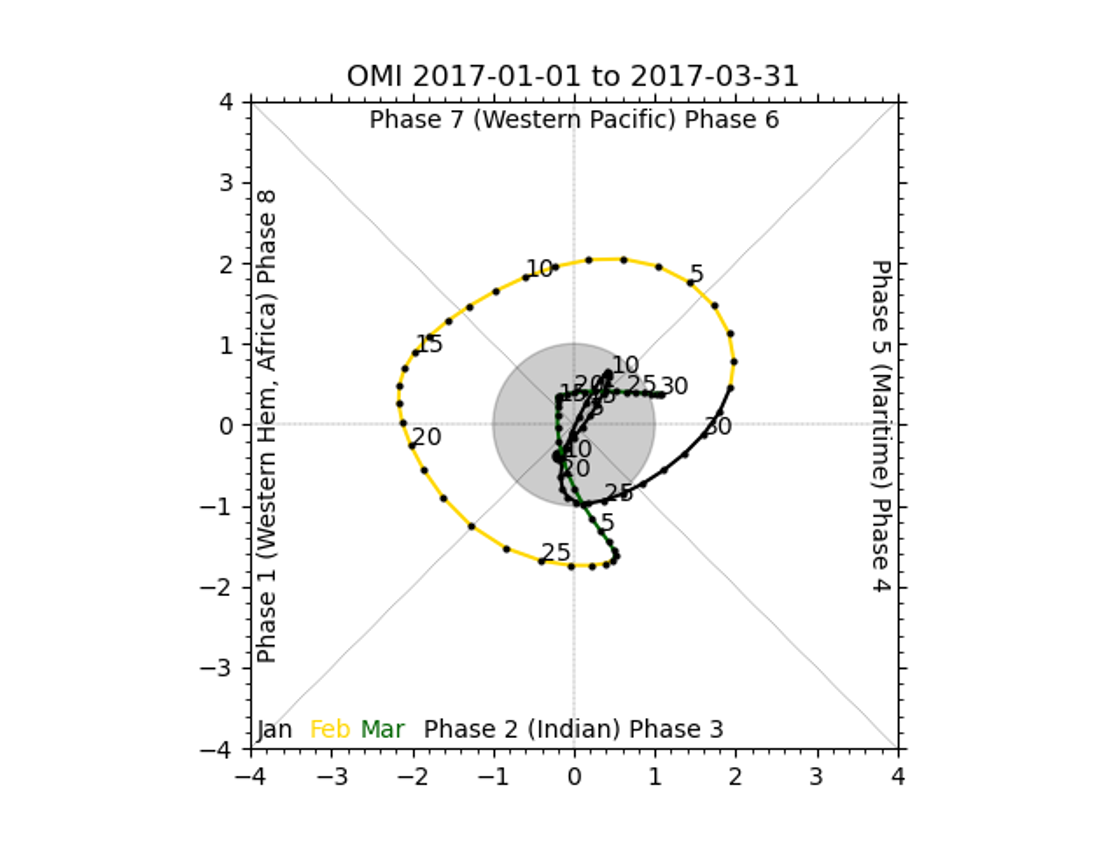
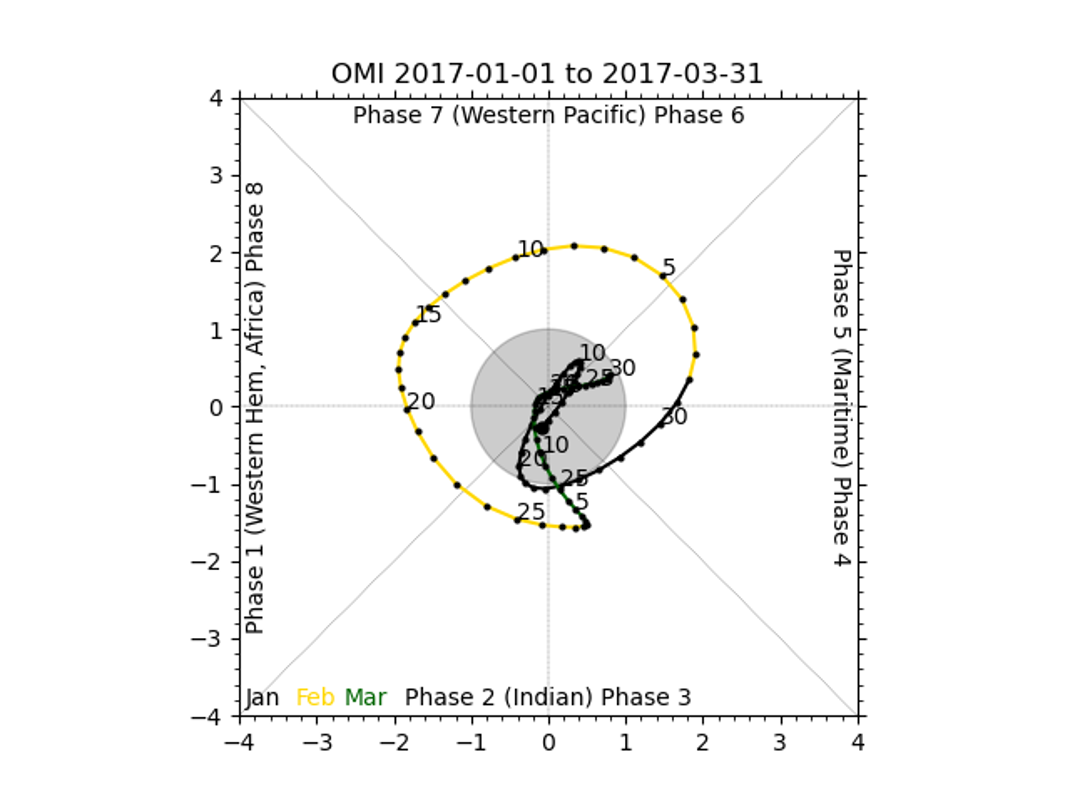
There should be 2 plots inside this directory, fcst_OMI_comp_phase.png and obs_OMI_comp_phase.png. The graphics should match those displayed below.