METreformat Overview:
The METreformat Python package was developed to assist in the generation of METplotpy line plots using MET Point-Stat .stat files. METreformat is located in the METdataio repository and utilizes the METdbLoad package for reading Point-Stat files.
The initial versions of the METviewer tool read MET verification statistics output from a database and created plots using R script for statistics and plotting. METplotpy and METcalcpy Python packages were developed to remove the dependency on R for plotting and statistics. METviewer now utilizes METplotpy Python scripts. The METplotpy plots that are available in METviewer are located in the /metplotpy/plots directory of the METplotpy repository. The METplotpy repository also hosts contributed plots that are not available through the METviewer tool. These plots are located in a different directory in the METplotpy repository.
METviewer generates plots based on the database "view" of the input data. Reformatting the MET Point-Stat .stat files into the same format used by METviewer bypasses the need for METviewer and its database. For additional information about METviewer, please refer to the METviewer User's Guide.
The MET Point-Stat data consists of numerous columns with each statistic represented by a column. The various normal and bootstrap confidence limits are each represented by corresponding columns. Upon inspection of a Point-Stat .stat file, there are numerous columns, many of which may be lacking a column label. For additional information about the line types in MET Point-Stat, please refer to all of the tables in the MET User's Guide for Point-Stat.
The METviewer database "view" consists of individual statistics that are collected into the stat_name and the stat_value columns. The normal and bootstrap confidence levels are collected into one of four columns:
- stat_ncl
- stat_ncu
- stat_bcl
- stat_bcu
The METreformat package replicates this format.
Generic instructions for reformatting a sample MET Point-Stat .stat file are available on Read the Docs: METdataio User's Guide.
The Point-Stat line types that are currently supported in METreformat are as follows:
- FHO
- CNT
- CTS
- CTC
- SL1L2
Support for additional line types will be added in the future.
METreformat Components:
The METreformat package utilizes the METdataio METdbLoad package to read .stat files, label columns, and create an intermediate data structure (pandas dataframe). The METreformat package uses this data structure to reformat the data into a single file.
The reformatting requires a yaml configuration file and an xml specification file (from METdbLoad). The xml specification file is used to define the paths to the input data and the type of MET output (i.e. Point-Stat, Grid-Stat, MODE, Stat-Analysis, and Wavelet-Stat). The yaml configuration file indicates the location of the xml specification file and the name and location of the output file.
Example of running METreformat
Set up the prerequisites:
Set up the environment by following the instructions for METplus initial set up. Make sure to follow the relevant instructions for either the Pre-configured Environments or User Configured Environments, based on your host computer. Finish by following the Verify Environment Is Set Correctly instructions.
The Python requirements for METdataio are:
- Python 3.8.6 or above
- pymysql (not needed for this tutorial)
- pandas (1.5 or above)
- numpy (1.22 or above)
- pyyaml
- lxml
Make sure you have activated the conda environment for METdataio if you are working on your own host or on host 'seneca':
https://dtcenter.org/metplus-practical-session-guide-version-5-0/session-1-metplus-setupgrid-grid/metplus-setup/metplus-initial-setup/setting-tutorial-environment-seneca
Please refer to the METdataio User's Guide for more information on METdataio.
cd ${METPLUS_TUTORIAL_DIR}/metdataio
git clone https://github.com/dtcenter/METdataio
Reformat MET Point-Stat .stat files
An overview of the steps for running this example are:
- Set the PYTHONPATH and METDATAIO_BASE environments
- Copy the yaml configuration and xml specification file to the user_config directory
- Modify the yaml configuration and xml specification files in the user_config directory
- Run the Python script to reformat the sample data
Work in bash shell, at the command line, enter the following:
bash:
cp $METDATAIO_BASE/METreformat/point_stat.yaml ${METPLUS_TUTORIAL_DIR}/metdataio/user_config
cp $METDATAIO_BASE/METreformat/point_stat.xml ${METPLUS_TUTORIAL_DIR}/metdataio/user_config
Next, we need to modify the point_stat.xml file to include the correct directory path to the input data. In order to do this, we need to obtain a full path to where the input data is, copy it, and paste that path inside the .xml file.
That command should return a path similar to the following example:
Alternatively, you can open a text file and copy and paste the directory path into the text file for easy use.
<folder_tmpl>/d1/projects/METplus/METplus_Data.v5.0/met_reformat/point_stat</folder_tmpl>
<verbose>true</verbose>
<load_val>
<field name="met_tool">
<val>point_stat</val>
</field>
</load_val>
<description>MET output </description>
</load_spec>
All we have done in the file is replace the content between the <folder_tmpl> </folder_tmpl> with the full path to the data, complete with the met_reformat/point_stat subdirectories.
Now we need to modify the point_stat.yaml file in a similar way to the point_stat.xml file. In order to do this, we need to obtain a full path to the $METPLUS_TUTORIAL_DIR, copy it, and paste that path inside the .yaml file in multiple areas.
That command should return a path similar to the following example:
output_filename: point_stat_reformatted.txt
xml_spec_file: /d1/personal/user/METplus-5.0.0_Tutorial/metdataio/user_config/point_stat.xml
In the above example, the output_dir entry of /path/to/output_dir was replaced with the full path of the METPLUS_TUTORIAL_DIR/metdataio. The xml_spec_file entry replaced /path/to/xml_file with the full path of the METPLUS_TUTORIAL_DIR/metdataio/user_config along with the point_stat file name. NOTE: make sure you have one space between the colon (:) and your settings.
We are now ready to generate the reformatted file from the sample Point-Stat files in the METPLUS_DATA/met_reformat/point_stat directory. To understand how the file changes, we will look at a .stat file that has not been reformatted.
Observe how there are numerous columns of data, some of which are lacking descriptive names (i.e. 'MODEL', 'FCST_LEV', etc.). This can be a confusing file to read for users that are unfamiliar with .stat file layouts.
The following will be sent to the terminal and are generated by METdbLoad (the warning message can be safely ignored):
51 VCNT
150 VCNT
244 VCNT
518 VCNT
525 VCNT
532 VCNT
539 VCNT
546 VCNT
553 VCNT
560 VCNT
567 VCNT
574 VCNT
581 VCNT
588 VCNT
595 VCNT
602 VCNT
609 VCNT
1238 VCNT
1245 VCNT
1252 VCNT
1259 VCNT
1266 VCNT
1273 VCNT
1280 VCNT
1287 VCNT
1294 VCNT
1301 VCNT
1308 VCNT
1723 VCNT
1822 VCNT
1921 VCNT
2015 VCNT
Name: line_type, dtype: object
A text file will be created in the $METPLUS_TUTORIAL_DIR/metdataio directory named point_stat_reformatted.txt (as specified in the point_stat.yaml config file).
You will notice that the data has been reformatted where the statistics are now under stat_name and stat_value, and the presence of the stat_bcl, stat_bcu, stat_ncl, and stat_ncu columns. All columns have names.
Generate a METplotpy line plot
METplotpy Set Up Prerequisites:
The Python requirements for METplotpy are found in the User's Guide, under the Installation section.
If you are working on a host that does not have the necessary Python packages installed, create your own conda environment using the instructions provided by the Seneca host instructions as guidance.
Continue working in the bash shell.
METcalcpy is a requirement for METplotpy. The following description is one of numerous methods to set up the working environment to utilize METcalcpy from the METplotpy source code. These instructions are suitable for users that are not working within a conda environment:
cd ${METPLUS_TUTORIAL_DIR}/metcalcpy
git clone https://github.com/dtcenter/METcalcpy
- Method 1: Follow instructions in the Installation section of the METplotpy User's Guide: Install METcalcpy in the conda environment.
- Method 2: Using using PyPI (Python Package Index) enter the following:
cd ${METPLUS_TUTORIAL_DIR}/metplotpy
git clone https://github.com/dtcenter/METplotpy
An overview of the steps for creating this plot are:
- Set the PYTHONPATH and METPLOTPY_BASE environments
- Copy the yaml configuration file to the user_config directory
- Modify the yaml configuration file in the user_config directory
- Run the Python script to create a line plot
Set the PYTHONPATH and METPLOTPY_BASE environment variables
For this step, you'll need to choose the appropriate command depending on how you installed METcalcpy. Read both blue instruction blocks, and proceed with the one relevant to you.
bash:
bash:
Copy custom config file to user_config
To get this started, we need to create a user_config directory.
Modify the custom configuration file
We will need to modify the output directory in the file with a full path to where we curerntly are, ${METPLUS_TUTORIAL_DIR}/metplotpy/user_config. In order to do this, we need to copy the full path, and paste that path inside the .yaml file.
That command should return a path similar to the following example:
- '#ff0000'
con_series:
The above change will produce a red line on the final graph.
- 1
create_html: 'False'
#- - CONTROL RH MAE
# - GTS RH MAE
# - DIFF
#derived_series_2: []
There is only one model in the sample data and event equalization is not needed.
WIND:
- F_RATE
# TMP:
# - ME
fixed_vars_vals_input:
fcst_lev:
fcst_lev_0:
- Z10
- '0'
- '1'
- '5'
indy_vals:
- '0'
- '10000'
- '50000'
list_stat_1:
- F_RATE
list_stat_2:
list_static_val:
plot_ci:
- std
plot_disp:
plot_disp:
- 'True'
plot_filename: ./line.png
- '-'
series_line_width:
- 1
series_order:
- 1
series_symbols:
- .
series_type:
- b
series_val_1:
model:
- FV3_GFS_v15p2_CONUS_25km
#series_val_2:
# model:
# - CONTROL
# - GTS
- 'False'
stat_input: ./line.data
#lines:
#- color:
'#8000ff'
# line_width: '2'
# position: '11'
# type: horiz_line
# line_style: '--'
#- line_style: '-'
# color: '#000000'
# line_width: 1
# position: "18"
# type: vert_line
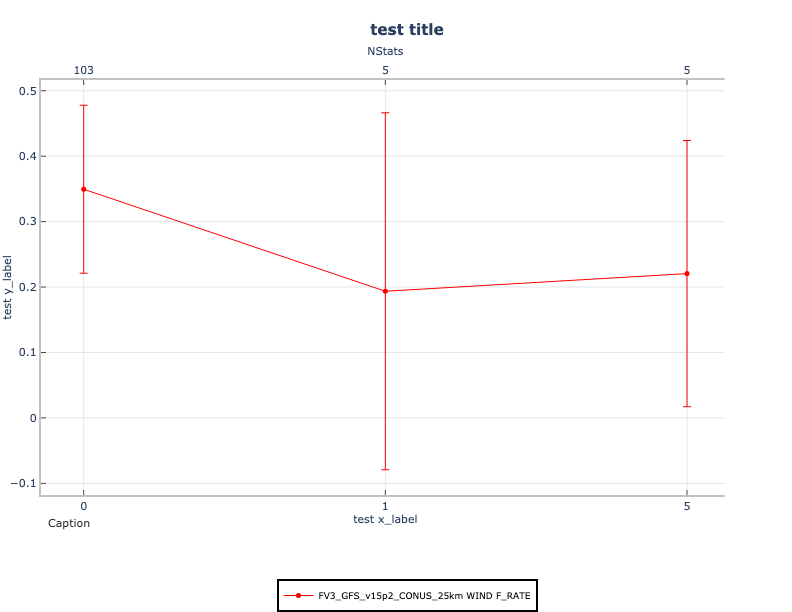
Generate the line plot:
Your line plot will look like the following: