Verification Statistics for Multicategorical Forecasts
In order to make sense of how the statistics are modified when evaluating multiple categories, it will help to look at how the contingency table changes. The generalized contingency table for a three category table will look like the following:
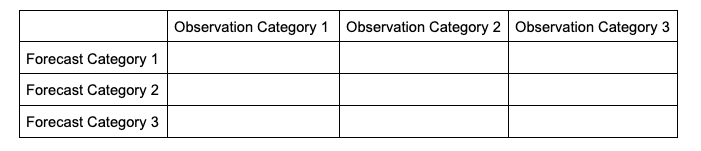
A similar table could be constructed for comparisons of four, five, six, and so on, categories. Some statistical calculations are more easily computed when forecasts and observations are restricted to two options (as was the case in binary categorical forecasts), so one less common approach for a multi-category contingency table is to process the full table into multiple instances of 2x2 grids, focusing on one forecast category at a time. This way, each forecasted event or category can have scalar attributes calculated, as well as skill scores that reflect the entire forecast’s quality across the multiple categories. This is not a valid approach for calculating, among others, Heidke Skill Score and Gilbert Skill Score, but is considered here for a well-rounded approach to multicategorical verification.
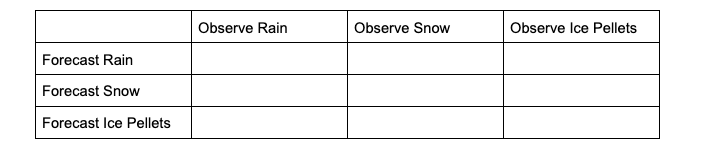
To demonstrate how scalar attributes are calculated for a multicategory forecast, imagine a scenario where the forecast can call for three separate precipitation types: rain, snow, and ice pellets. For this scenario, forecasts and observations of no precipitation are ignored (i.e., this evaluation is conditioned on some type of precipitation both occurring and being forecasted).
The contingency table would look like the following:
To extract the scalar attributes for rain, the simplified, 2x2 contingency table would look like this:
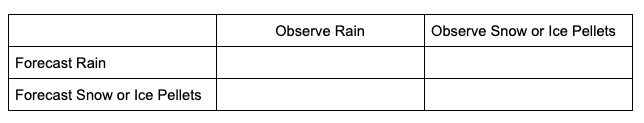
The same simplification can be done for snow and ice pellets. As this new 2x2 contingency table demonstrates, by reducing the multicategorical options to the binary choices of each forecasted event (e.g., did the forecast predict rain rather than snow or ice pellets, did the forecast predict snow rather than rain or ice pellets, did the forecast predict ice pellets rather than rain or snow) and evaluating the corresponding observations, scalar statistics such as POD, Bias, etc. can be calculated in the same method as the binary categorical forecasts.
One of the unique scalar statistics that does not need a contingency table simplification is Accuracy (Acc). This is due to its definition, which, when presented in its general format, becomes:
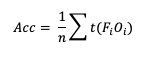
Note that t(FiOi) is the number of forecasts in category i of the multicategory contingency table that had an observation of Oi and n is the total number of occurrences and non-occurrences.
With this general format of Accuracy, essentially we seek to answer the question “how capable was the forecast at selecting the exact category?” To demonstrate how this would look in a 3x3 contingency table, let’s return to the previous scenario of a three precipitation type forecast. A perfect Accuracy forecast would have nonzero values only in the “Forecast Rain, Observation Rain”, “Forecast Snow, Observation Snow”, and “Forecast Ice Pellets, Observation Ice Pellets” cells, with the remaining cells being zero. The same top-left corner to lower-right corner of nonzero cells pattern would exist in the simplified 2x2 contingency table. Because no information about the forecast’s Accuracy is lost for the full count of forecast categories, Accuracy is the only scalar statistic that METplus will calculate from the full multicategory contingency table. See how to use this statistic in METplus!