News | Visitors

Visitors

Cloud Overlap Evaluation for HAFS Tropical Cyclone Predictions

Winter 2024

During their recent project for the DTC Visitor Program, Michael Iacono and John Henderson of Verisk - Atmospheric and Environmental Research (AER) used the newly operational Hurricane Analysis and Forecasting System (HAFS) to evaluate the impact of an improved method to represent the sub-grid variability and vertical overlap of partial cloudiness in radiative transfer calculations on tropical cyclone predictions. This work was an extended application of their exponential (EXP) cloud overlap advancement that was adopted by NOAA in the 2018 operational Hurricane Weather Research and Forecasting (HWRF) model, and of their exponential-random (ER) method that NOAA adopted in the operational HWRF in 2020.


Understanding the way that clouds absorb, emit, and scatter radiation is essential to modeling their role in Earth’s radiative processes effectively.

Clouds are a critical component of Earth’s climate. They strongly influence both the incoming solar (or shortwave) energy, which fuels the climate system, and the thermal (or longwave) energy that is emitted by the surface and partially escapes to space. Understanding the way that clouds absorb, emit, and scatter radiation is essential to modeling their role in Earth’s radiative processes effectively.

One limitation to simulating clouds and their radiative impact accurately is the challenge of representing their variability on scales smaller than the typical grid spacing of global atmospheric models (~10 km) and regional models such as HAFS (~2 km). Radiative transfer through sub-grid scale clouds depends on whether fractional clouds are vertically correlated, such as in tall thunderstorm clouds, or uncorrelated such as for randomly distributed polar clouds. This radiative process is also dependent on properly simulating cloud fraction and both the physical and optical properties of clouds.

Using the Rapid Radiative Transfer Model for Global Climate Models (RRTMG) radiation code in HAFS, the primary objective of this project was to establish whether any predictive benefit is gained by using EXP or ER. These methods have been shown to be more realistic relative to radar measurements within vertically deep clouds when compared with the older maximum-random (MR) method currently used in HAFS. The MR approach forces the clouds to be more vertically coherent through adjacent partly cloudy layers. EXP and ER relax this restriction by allowing the correlation to transition exponentially from maximum to random with vertical distance through the cloudy layers. A small adjustment is provided by a spatially dependent decorrelation length. ER adds a further randomization between cloudy layers separated by clear sky relative to EXP. The exponential treatments modestly increase total cloudiness and reduce shortwave radiation reaching the surface relative to MR cloud overlap.


Hurricane Idalia track (left), central pressure (center), and maximum wind speed (right) for the observed “best track” values (black) and the HAFS modeled values for a forecast cycle initialized at 12 UTC on 27 August 2023 for the operational HAFS-A (gray) and three forecasts using the near-operational HAFS-A model for three treatments of cloud overlap (MR, blue; EXP, green; and ER, red).

To assess this advancement in HAFS, hurricane predictions were performed by AER with the assistance of the DTC for multiple 2022 and 2023 tropical cyclones using MR, EXP, and ER cloud fraction overlap and a latitude-varying decorrelation length. The figure shows predictions of Hurricane Idalia track (left panel), central pressure (center panel), and maximum wind speed (right panel) for a forecast cycle initialized at 12:00 UTC on 27 August 2023.  Observed “best-track” values are in black, predictions from the real-time operational HAFS-A are in gray, and predictions from a near-operational version of HAFS-A using MR, EXP, and ER cloud overlap are in blue, green, and red, respectively.  Although the operational HAFS-A run also used MR cloud overlap, it applied the warm-start method for vortex initialization, which improved its prediction. The three forecasts performed by AER used cold-start initialization, and therefore are not directly comparable to the operational forecast. Although the track of Idalia was not very sensitive to the overlap method in this case, both measures of Idalia’s intensity show much greater sensitivity to cloud overlap, which suggests some predictive benefit of using the exponential approaches. 

Our interactions with the DTC have been a rewarding opportunity to investigate new directions on this research topic, to work with two operational hurricane models, and to transition critical physics enhancements to NOAA operations. We expect to continue pursuing further research collaborations with the DTC and NOAA/EMC in the future.


John M. Henderson and Michael J. Iacono

Cristiana Stan and Loren Doyle

Autumn 2023

Cristiana Stan of George Mason University originally proposed a very exciting and new type of DTC visitor project that involved holding a “hack-a-thon” where teams of two graduate students would be tasked with selecting and developing a METplus Use Case for one of the subseasonal to seasonal (S2S) metrics identified during the 2021 DTC UFS Evaluation Metrics Workshop.  The winning team would then be given the opportunity to visit the DTC for up to three months to collaborate with the METplus team on continuing to integrate additional S2S diagnostics into METplus. Unfortunately, there was insufficient interest from students to make the hack-a-thon work.  With an eye towards maintaining the original goal of increasing student engagement and experience with METplus, the DTC worked with professor Stan to modify the scope of her  project. At the time, Cristiana was already working to create a METplus Use Case for a metric  developed by her research group to monitor the El Niño Southern Oscillation that would be implemented at NOAA’s Climate Prediction Center as part of a Test Bed project. The scope of the DTC visitor project was to expand the existing use case and make it applicable to forecast data. 

As a result, both Cristiana Stan and her graduate student, Loren Doyle, visited the DTC in 2023. Loren visited during the Spring and Summer and Cristiana during the Summer.  They  met with Danial Adriaansen, John Halley Gotway, Christiana Kalb, and John Opatz to discuss implementation of METplus with two metrics designed to evaluate the relationship between the Madden Julian Oscillation and the El Niño Southern Oscillation.  A previous use case creating these metrics using METplus had already been added to the METplus repository, but input data needed to shift to UFS data, which created new obstacles. Additionally, Cristiana and Loren were able to review the ongoing work to improve METplus’ usability through a focus group and provide their own experience with METplus and opportunities for improvement with the unique perspective of research development.


UFS MaKE and MaKI indices plot

While the visit included some hybrid meetings, the in-person meetings benefited from the diagrams drawn with the dry erase markers on the ‘traditional’ white boards. For example, the subseasonal to seasonal (S2S) forecast systems use different strategies for initializing the forecasts. The initial conditions vary from a particular date to a particular day of the week and/or from a few times a week to every day of the week. METplus diagnostics must be flexible to accommodate datasets with different structures as well as sizes and being able to visualize these structures was helpful for adapting existing capabilities in METplus and informing developers of the future developments.


Cristiana Stan and Loren Doyle, George Mason University

Developing a METplus use case for the Grid-Diag tool

Visitor: Marion Mittermaier

Summer 2023

Marion Mittermaier’s visitor project focused on developing a METplus use case for the Grid-Diag tool, which creates histograms for an arbitrary collection of data fields and levels. Marion used the Grid-Diag tool to investigate the relationship between the forecasted and observed precipitation accumulations for GloSea5, the UK Met Office ensemble seasonal prediction system and how the relationship evolved over time. The project is a sub-task of a larger body of work that uses several METplus capabilities with the objective of exploring the predictability of dynamical precursors of flooding in the Kerala region of India, a region that experienced severe flooding in successive monsoon seasons between 2018 and 2020 (see Figure).

Marion was surprised to find the level of agreement between the forecast and observations was very high, even without any form of hindcast adjustment.  The Grid-Diag tool has shown that it can provide very useful and swift analysis of the associations between variables.


Figure: a selection of joint distributions for the 2019 monsoon season, charting the evolution of the distributions as the season progresses (top panel) and a conceptual model capturing the basic features of the joint distributions (bottom panel).

Often, other opportunities for collaboration present themselves on visits, and sometimes simple in-person communication can lead to a greater understanding of the models and/or software and tools developed at the DTC, which was definitely the case during Marion’s visit in August 2022.

METplus’s lead software engineer, John Halley Gotway “really enjoyed brainstorming novel applications of the TC-Diag tool with Marion, and doing so face-to-face through the DTC visitor program made for a very fruitful collaboration! Getting direct and detailed feedback about METplus from engaged scientists really helps inform future directions.”

Marion’s visit also provided her with an opportunity to learn about and explore a relatively new METplus tool, Multi-variate MODE (Method for Object-based Diagnostic Evaluation), which provides the capability to define objects based on multiple fields.  Marion commented that “I’ve now successfully processed 6 months’ worth of forecasts using the complex use case. The analyzing process commences now, but it’s pretty cool to have come this far. Mountains of output have been generated. I wouldn’t have been able to do this without the time [Tracy] offered to walk me through it and I want to thank [Tracy] again. I can’t begin to say how valuable the visit last summer was. The time I spent with [Tracy], even though it was only an hour or two, was some of the “gold dust” that one hopes to find on these trips. It might not have been at the very top of my list of objectives for the trip but it has certainly contributed to making it the most productive trip in terms of “figuring stuff out” that I’ve learned. It’s proof that the visitor program does work but it wouldn’t work without all the people who are willing to give up their time to speak to us. That session made a very significant “penny drop” in my brain about METplus in a lot of ways. It’s like something clicked.”


This is proof that the visitor program does work but it wouldn’t work without all the people who are willing to give up their time to speak to us.

The benefits from these visits go both ways. Tracy Hertneky, one of DTC’s scientists commented, “It was lovely to meet and work with Marion, even in the brief time spent guiding her through METplus and in particular, the complex and relatively new Mulit-variate MODE use case, which ingests 2+ fields to identify complex ‘super’ objects. I was happy to share my knowledge and expertise with her as I feel that these connections are one of the most valuable aspects of our work. As the multivariate MODE tool is enhanced, Marion and her colleagues may even be able to test the tool and provide valuable outside feedback on its usage.

How do TC-specific Planetary Boundary Layer (PBL) physics impact forecasts across scales and UFS applications?

Visitor: Andrew Hazelton

Winter 2023

One of the most important aspects of numerical modeling is the series of approximations made to represent certain physical processes, known as “parameterizations.” These approximations of critical atmospheric phenomena can make a huge impact on the solutions that a model provides, so making these parameterizations more accurate across a variety of applications is a major goal of numerical weather prediction (NWP).

One of the primary goals of this 2022 DTC Visitor Project was to examine how planetary boundary layer (PBL) physics changes affect atmospheric prediction across a variety of scales and applications, specifically on tropical cyclones (TCs) and synoptic weather. This was done through two avenues of research.

Hurricane Laura Runs

One task for this project was to examine how model physics affect TC forecast skill across a variety of scales and different Unified Forecast System (UFS) applications. The case chosen for this analysis was Hurricane Laura (2020). Two different Hurricane Analysis and Forecast System (HAFS) versions (both with 2-km grid spacing, with differing microphysics and PBL physics) exhibited a notable left bias in track (orange and green lines in Figure 1). The UFS short-range-weather (SRW) runs at 3-km grid spacing using two similar physics suites (red and blue lines) also showed a similar leftward bias. However, two SRW runs with 13-km resolution gave relatively accurate track forecasts using the same two physics suites. This indicates that the behavior of the model physics at the higher resolution might be part of the problem. This motivates us further to examine ways that model physics impact atmospheric flow at different resolutions, as explored in the next section.


Figure 1: Track forecasts for Hurricane Laura initialized at 00 UTC August 25, 2020 for two 2-km HAFS configurations (orange and green), two 3-km SRW configurations (red and dark blue), and two 13-km SRW configurations (magenta and light blue).

GFS With Modified PBL Physics

We collaborated with Dr. Sundararman Gopalakrishnan and Dr. Xiaomin Chen to implement a modification to the turbulence kinetic energy (TKE)-based eddy-diffusivity mass-flux (EDMF-TKE) PBL physics in HAFS (known as the tc_pbl), to better represent turbulent mixing in the TC boundary layer (e.g. Chen et al. 2022, 2023, Hazelton et al. 2022). Several of these changes were based on large-eddy simulations (LES) conducted by Dr. Chen, and results showed improvement to TC structure and intensity in HAFS. We wanted to see how these changes impact large-scale atmospheric prediction. To accomplish this, we ran a month (September 2022) of forecasts of the global forecast system (GFS, which uses a physics configuration generally similar to HAFS-A), the global component of the Unified Forecast System (UFS), at 25-km resolution. Figure 2 shows the 500-hPa anomaly correlation from the default (black) and modified (red) forecasts. The modifications produce slightly lower global skill. This tells us that we need to work further to unify these changes to the PBL physics so that they improve forecast skill, not only for TC applications, but also for other worldwide prediction regimes and applications.


Figure 2: Anomaly Correlation of geopotential height (500 hPa) for September 2022 GFS runs using default (black) and modified (red) EDMF-TKE PBL physics.

The DTC visitor program provided an excellent opportunity to meet and collaborate with other scientists working on various aspects of UFS, at DTC and EMC, and gain a better understanding of the types of model physics evaluation and testing being performed across a variety of scales and applications. We are especially appreciative of the guidance and support provided by DTC collaborators Brianne Nelson from NCAR, Linlin Pan from CIRES/GSL, Man Zhang from CIRES/GSL, and Evelyn Grell from CIRES/PSL in setting up this project. Kate Friedman and Mallory Row from EMC were very helpful in running the GFS and the global verification.

Ongoing and future work on this topic includes applying the modified PBL physics (tc_pbl) to the UFS SRW application to see how it impacts TC and other forecasts on both 3-km and 13-km scales in that configuration. We also plan to examine how the “scale-awareness” (adjustments for the grid size) is being handled in HAFS, and whether modifications to this adjustment can improve the model physics and TC forecasts.


Andrew Hazelton

Development of GSI Multiscale ENKF Data Assimilation for Convection-Allowing FV3 Limited Area Model

Visitor: Chong-Chi Tong

Summer 2022

Accurately predicting weather down to the convective storm scales requires setting initial model conditions that accurately represent the atmospheric state at all scales (from the planetary through synoptic large-scale, mesoscale, to convective). The importance of these various interactions can not be overlooked.  A well-performing data assimilation (DA) system must accurately analyze flow features at all scales. For this visitor project, a multi-scale DA capability within the GSI-based Ensemble Kalman Filter System (EnKF) system was proposed for the FV3 limited-area model (LAM) that can assimilate both dense convective-scale data, such as those of radar and high-resolution GOES-R observations, as well as all other coarser-resolution data. The operational GSI hybrid Ensemble Variational (EnVar) system was recently selected to work with the FV3 LAM system that runs at NCEP which does not yet have a self-consistent multi-scale EnKF system. The EnKF is a prerequisite for an optimal multi-scale hybrid EnVar system because EnKF is essential to provide ensemble perturbations for reliable flow-dependent covariance estimation.

For the planned operational use of  the FV3 LAM for convection-allowing model (CAM) forecasts over CONUS or larger domains, the multi-scale DA issue must be properly addressed. Two main goals proposed for this visitor project were to:  

  1. develop a GSI-based multiscale EnKF DA system capable of effectively assimilating all observations sampling synoptic through convective scales for balanced NWP initial conditions on a 3-km continent-sized CAM-resolution grid, and 
  2. test the multiscale DA system coupled with FV3 LAM using retrospective cases, tune and optimize the system configurations, including the filter separation length scale, localization radii, covariance inflation, etc.

The advantageous performance of MDA on the prediction of storm systems, mostly in reducing overforecast in both coverage and intensity, over the regular single-scale EnKF experiment. The positive impact of the MDA was found to be even more significant in the performance of individual ensemble members as well as the ensemble average.

The proposed multiscale DA (MDA) method uses filtered background covariances with long localization lengths for assimilating conventional observations that sample synoptic to meso-scale perturbations. Sensitivity experiments were performed to determine ideal filtering-length scales sufficient to diminish unfavorable noise in analyses. In addition, the height-dependent filtering length was proposed and its impact was examined with one-time upper-air data assimilation; the benefit was evident for up to 24 hours in subsequent forecasts, particularly for prediction of humidity. The post inflation in the GSI, relaxation to prior spread (RTPS), was optimized accordingly for MDA to restore only the large-scale background perturbations, which prevents reintroducing small-scale noise in analyses. The MDA was examined with a hourly cycled update configuration for 12 hours for real cases and its impact was evaluated. In terms of the deterministic forecasts from the final ensemble mean analysis, consistent improvement of MDA was found in prediction of most variables for up to 48 hours when only assimilating conventional data; when including radar DA, the benefit of MDA was relatively limited on the storm prediction and humidity forecast, for a shorter lead time. The figure below gives an example of the advantageous performance of MDA on the prediction of storm systems, mostly in reducing overforecast in both coverage and intensity, over the regular single-scale EnKF experiment. The positive impact of the MDA was found to be even more significant in the performance of individual ensemble members as well as the ensemble average. Our ongoing work will apply the MDA method to more cases to support a statistically robust conclusion.


Figure: 12-h forecast composite reflectivity, valid at 1200 UTC 21 May 2021, for CNTL (middle) and MDA (right) experiments with both conventional and radar reflectivity DA, as compared with the MRMS observation (left).


It has been a precious experience to work under the DTC Visitor Program, especially during the critical pandemic period. During the one-month on-site visit period, I was able to collect all the data necessary for the planned retrospective experiments with assistance from the DTC Data Assimilation team. Valuable input toward the work was provided by regular weekly meetings with DTC members Drs. Ming Hu and Guoqing Ge, the program host Mr. Will Mayfield, and Ivette Hernandez (also a visitor, but on another project) throughout the entire one-year Visitor Program period.


Chong-Chi Tong

From Innovations to Operations, the DTC Visitor Program Stimulates Progress

Visitor Program: An Overview

Spring 2022

Since 2004, one of the hallmarks of the Developmental Testbed Center (DTC) has been its visitor program. The DTC Visitor Program provides an opportunity for DTC staff and our operational partners to strengthen ties with the research community, which is critical to the success of the DTC’s mission. It began informally when four scientists were invited to work with us for one month over the summer on a project of their choice. The only stipulation was that it had to be consistent with the DTC’s mission. The success of that initial group of visits led to a formal program that started with one-month visits whereby those who wanted to visit submitted proposals in response to the Announcement of Opportunity (AO). Eventually, the program expanded to allow for the two-month visits offered today and the ability to submit proposals year-round. Longer visits for graduate students were also added with the aim of advancing the students’ knowledge about DTC-related work, leading to the two types of projects now supported by the program. Historically, the majority of visitors have come from universities, but visitors from research centers and private companies have also been a strong part of the program (see pie chart figures). The program has also provided the DTC with an avenue to connect with the international community. 

The DTC has hosted a wide array of visitors including both projects conducted by the principal investigator (PI) and projects undertaken by a graduate student under a PI’s direction. Recent PI-led projects include a physics-based evaluation of the Hurricane Analysis and Forecast System (HAFS); an investigation of sub-grid variability and vertical overlap of partial cloudiness within the calculation of atmospheric radiative transfer, work to facilitate the transition of cutting-edge data assimilation techniques into operational NWP modeling; and the implementation of spatial dissimilarity measures into the enhanced Model Evaluation Tools (METplus) verification system.

Ivette Hernandez-Banos was a recent international student visitor who made her way to the DTC just weeks before we transitioned to working from home due to the COVID pandemic, and managed to work through the lockdown. Her success led to an additional DTC project and ultimately she took a job at NCAR in the Mesoscale and Microscale Meteorology Laboratory. Her visit formed part of her doctoral research at Centro de Previsão de Tempo e Estudos Climáticos (CPTEC)/ Instituto Nacional De Pesquisas Espaciais (INPE, Brazil) and she had many fruitful interactions with people from the DTC including Louisa Nance, Ming Hu, Guoqing Ge, Will Mayfield, and Eric Gilleland, in addition to Jacob Carley and Daryl Kleist from EMC.


A look at the Visitor Projects since 2010: The total number of awarded Visitor Projects (not individual participants) on the left. Of the 41 University Visitor Projects, 14 of these were for graduate students on the right. The DTC started supporting PI and graduate student projects and providing 2 months of support for visitor projects in 2010, reflected in these numbers.


Close collaboration with NOAA research and operational centers is essential for effective research-to-operation (R2O) transitions. Dr. Xuguang Wang visited EMC during her sabbatical in Fall 2018. She collaborated with EMC scientists on data-assimilation research and development. The visit expedited the transition of the capability for directly assimilating ground-based radar observation, developed by her Multiscale data Assimilation and Predictability research team, into the operational High-Resolution Rapid Refresh (HRRR) and ultimately the Hurricane Weather Research Forecast (HWRF) system.

Mike Iacono and John Henderson, who visited the DTC from industry on multiple occasions, have found their interactions with the DTC to be a rewarding opportunity as it afforded them new insights on this research topic, and successfully transitioned physics enhancements to NOAA operations. The new exponential random cloud overlap method they developed in their most recent DTC visitor project was transitioned into the 2020 operational HWRF, after testing and evaluation performed by DTC showed that it resulted in improved tropical cyclone track forecasts. This team of Iacono/Henderson split their visit into multiple shorter visits and even split them between the 2 PIs.

Obviously, the COVID pandemic made it difficult to host in-person visits, but we nevertheless were able to host visitors virtually. As the pandemic begins to wind down, we have been able to once again host visitors on-site. For example, Chong-Chi Tong and Bill Gallus were both able to join us in person last Fall as the capability for staff to work in the building again has gradually increased. Bill Gallus also has conducted multiple projects with the DTC Visitor Program, as have other individuals and teams. 

It has been a very exciting and successful program that has brought many advances from research into operational use over the years, even during the pandemic. Now that our buildings and cities are starting to open back up, we’ve had an uptick in visitor applications, with two recently approved. 

Past visitors have expressed appreciation, gratitude and value about their visitor project experiences. One visitor, Don Morton, proclaimed his visits to be the high points of his 30+ year career. The visitor projects are also high points for the lucky DTC staff who gain valuable knowledge and insights from these visitors. Past Visitor highlights that include project details and personal perspectives about the project can be read at DTC Newsletter | Visitors Articles. For a deeper dive, read the DTC Visitor Reports.


Physics Process-based Evaluation of the Hurricane Vortex Structure and Size of Tropical Cyclones in HAFS

Visitor: Shaowu Bao

Winter 2022

The Hurricane WRF (HWRF) has been the US operational hurricane forecast model since 2007. The Hurricane Forecast and Analysis System (HAFS), based on the GFDL Finite­-Volume Cubed-Sphere Dynamical Core (FV3), a scalable and flexible dynamical core, is the likely candidate to replace the operational HWRF. HAFS is the focus of a Unified Forecast System - Research to Operations (UFS-R2O) hurricane modeling project and the next generation hurricane forecast system. For the DTC Visitor Project, my study used satellite imagery to evaluate the HWRF and HAFS model forecasts. The tropical cyclone’s (TC) track and max wind of the models have been extensively evaluated, so to go beyond the track and max wind, we conducted a physics process-based evaluation of the hurricane vortex structure and size using the Geostationary Operational Environmental Satellites—R Series (GOES-R) data, which has global coverage, and visible and infrared bands for hurricane observing. The goal was to compare the model-generated synthetic satellite imagery to the observed satellite imagery to see how realistically they can be simulated and what systematic biases exist, thereby providing insight for model developers to further improve the model performance.

This past year, the DTC team evaluated and tested HAFS with two physics parameterization suites: the NCEP Global Forecast System (GFS) suite and the HWRF suite. The original goal of this DTC Visitor Project was  to compare the testing results to observations to determine which physics suite, GFS or HWRF, produces more realistic hurricane structure forecasts. The model synthetic imagery was created by the UFS Unified Post-Process (UPP). Thousands of images were compared, and the results revealed that when the HWRF physics suite was used in HAFS, the model generated exceptionally large hurricane vortices. See the figure below with an example of hurricane Dorian in 2019, located along the US East coast.


Figure 1. Comparison between the observed GOES-R imagery (OBS) with model synthetic imagery made from HAFS simulation with HWRF physics suite (HWRF_PHY) and GFS physics suite (GFS_PHY).


The HAFS is being actively developed at NCEP Environmental Modeling Center (EMC). A seasonal test of HAFS (using a highly modified version of the GFS physics suite plus other advancements such as coupling with an ocean model) was performed at EMC in the summer of 2021. EMC suggested that it would be beneficial to the HAFS model development if we could broaden the scope of the DTC visitor project  to include the evaluation mentioned above. To accomplish this, we had to develop a standalone software tool to read the model's archived atmosphere profile columns and surface features to create the model synthetic imagery, because the native output files from these tests, which are required for UPP to generate synthetic model imagery, had not been archived. We used Community Radiative Transfer Model (CRTM) v2.3 to  transform the model atmosphere properties and the hydrometeor profiles into synthetic model satellite imagery. This time, we focused on comparing the TC inner core (9 deg x 9 deg) against observations. We included the operational HWRF forecast in these comparisons. 

Tropical cyclones Dorian (2019), Laura (2020), and Teddy (2020) were compared.  As an example, Dorian's observed and model synthetic imageries from 18Z 2019-08-30 to 18Z 2019-09-06 are combined to form composite imageries; Figure 2 depicts the results. It appears that the HAFS model produced synthetic satellite imagery that was more accurate in terms of size and temperature than the HWRF model. This finding is also clearly demonstrated in the probability density function (PDF), where you can see that the PDF from HAFS and OBS matched well, but the PDF from HWRF result showed a large discrepancy from the other two, primarily because HWRF has a very large fraction in the cold end of the spectrum around 220 K, indicating that the HWRF model simulated a larger and colder vortex than OBS; the inner-core simulated HAFS, on the other hand, is slightly warmer than OBS.  These findings demonstrated that the HAFS improved the simulated vortex structure with more realistic size, structure, and brightness temperature.


FIgure 2. The comparison of the composite vortex imagery of Hurricane Dorian (2019) from observation, HAFS and HWRF models. THe Probability Density Function (PDF) of these three imageries are plotted.


As a former DTC team member, I've always enjoyed working with DTC colleagues to learn innovative ideas and techniques. Unfortunately, due to Covid-19, this year's visit was virtual, and I missed meeting the DTC team in person. Now, as an associate professor at the Coastal Carolina University's department of coastal and marine systems science, I teach coastal meteorology, hydrodynamics, and oceanography. My research focuses on the air-sea-coupled physical processes that occur in coastal areas during extreme weather events. The DTC software, such as the METplus, UPP, UFS, and CCPP, have been, and I believe will always be, a valuable tool that I use extensively in my research and teaching. 


Shaowu Bao

Cloud Overlap Enhancements Adopted for HWRF Operations

Visitors: Michael Iacono and John Henderson

Autumn 2021

During their recent project for the DTC Visitor Program, Michael Iacono and John Henderson of Atmospheric and Environmental Research (AER) used the Hurricane Weather Research and Forecasting model (HWRF) to investigate an improved way to represent the sub-grid variability and vertical overlap of partial cloudiness within the calculation of atmospheric radiative transfer. Their exponential-random (ER) cloud overlap advancement was adopted by NOAA in the 2020 operational HWRF. 

Clouds are a critical component of Earth’s climate in that they strongly affect both the incoming solar (or shortwave) energy, which fuels the climate system, and the thermal (or longwave) energy that is emitted by the surface and partially escapes to space after being transmitted, absorbed, and reemitted by the atmosphere. Understanding the way that clouds absorb, emit, and scatter radiation is essential to modeling their role in Earth’s radiative processes. 

One limitation to simulating clouds and their radiative impact accurately is the challenge of representing their variability on scales smaller than the typical grid spacing of dynamical atmospheric models such as HWRF and the NOAA Unified Forecast System (UFS). Radiative transfer through sub-grid scale clouds strongly depends on whether the clouds are vertically correlated, such as in tall thunderstorm clouds, or uncorrelated such as for randomly oriented, shallow cumulus under high thin cirrus. This radiative process is also strongly dependent on properly simulating cloud fraction and cloud physical and optical properties.

Using the RRTMG radiation code in HWRF, the primary objective of this project was to establish the relative benefits of using the exponential (EXP) cloud overlap assumption, which became operational in HWRF in 2018, and the ER method. Both approaches have been shown to be more realistic relative to radar measurements within vertically deep clouds compared to the older maximum-random (MR) method. The MR approach forces the clouds to be more vertically coherent throughout adjacent partly cloudy layers, while the EXP and ER methods relax this restriction by allowing the correlation to transition exponentially from maximum to random with vertical distance through the cloudy layers with small adjustment possible via a decorrelation length parameter. ER adds a further degree of randomization between cloudy layers separated by clear sky relative to EXP. The exponential treatments have the effect of increasing total cloudiness and reducing shortwave radiation reaching the surface relative to MR overlap. 


H220 forecast tracks over the first 60 hours with storm positions plotted every 12 hours for four predictions of Hurricane Joaquin initialized at 0000 UTC on 1 October 2015 for a set of four variations of ER cloud overlap. Best track observed positions of Joaquin are shown in black.

To assess this advancement in HWRF, hurricane simulations were completed with the assistance of the DTC and NOAA/EMC for multiple tropical cyclones using EXP or ER cloud fraction overlap and two methods for specifying the decorrelation length. Hurricane Joaquin, a 2015 Atlantic basin storm with an unusual track that was challenging to predict, was especially sensitive to the cloud overlap configuration as seen in the first figure, which shows the forecast track using four variations of the new cloud overlap methods. Statistics for a broader set of six Atlantic hurricanes, including the relative change in wind speed bias errors and in 34-knot wind radius errors seen in the second figure, suggest improvement using ER relative to the EXP cloud overlap method. 

Our interactions with the DTC have been a rewarding opportunity not only to acquire new insights on this research topic, but also to transition critical physics enhancements to NOAA operations, and we will continue to pursue further research collaborations with the DTC and NOAA/EMC in the future. 


Operational 2020 HWRF-predicted wind speed bias errors (top; in knots) and average 34-knot radius errors (bottom; in nautical miles) for two sets of predictions using EXP cloud overlap (H20C; red) and ER cloud overlap (H2R1; green) averaged over six North Atlantic tropical cyclones. Graphics provided by Bin Liu (IMSG at NOAA/EMC).

AER's Michael Iacono (left) and John Henderson (right)

(See Winter 2017 DTC Visitor article by Michael Iacono and John Henderson.)

Evaluating CCPP Physics Across Scales for Severe Convective Events

Visitor: William Gallus, Jr

Summer 2021


The DTC Visitor Program offers a unique means of gaining experience with state-of-the-art modeling and visualization approaches. During my visits with the DTC through this program the previous three times, I explored these diverse areas of study,  and was able to provide several graduate students with unique opportunities in these areas: 

  1. the DTC's first convection-allowing model (CAM) ensembles run back in the mid-2000s, 
  2. the Method for Object-based Diagnostic Evaluation (MODE) verification approach (which was new at that time), and
  3. the Community Leveraged Unified Ensemble (CLUE). 

The new FV3-LAM model is a limited-area version of the nonhydrostatic Finite Volume Cubed Sphere dynamic core already running in the operational GFS model. This dynamic core is to replace most, or all, of the current models running operationally in the next few years, including those with convection-allowing grid spacing. Because my research has long focused on improved understanding and forecasting of convective- system evolution, I was invited to join an effort studying the impact of two different physics suites on several convective events. I am currently examining the output from my FV3-LAM runs using 3-, 13-, and 25- km horizontal grid spacing with physics packages closely matching the Rapid Refresh Forecast System (RRFS) and Global Forecast System (GFS), for three cases. The first case occurred in the northern Plains in May 2015, which was poorly predicted in my previous WRF runs. A second case that occurred in Texas during May 2019 was generally predicted well by CAM models. The third case, the infamous Midwestern Derecho of August 2020 that was the costliest single thunderstorm event in U.S. history, was poorly predicted by most CAMs, although some of the High Resolution Rapid Refresh (HRRR) and experimental HRRR runs from the evening before captured the event surprisingly well. The goal of the project is to see how well the physics suites perform through a range of horizontal grid spacing. 


Observed reflectivity at 18 UTC 10 August 2020 (upper left, from UCAR archive), compared to simulated reflectivity in a run with 25 km horizontal grid spacing (upper right), 13 km (lower left), and 3 km (lower right).

One of the more interesting findings involves the derecho event. By accident, 13- and 25- km horizontal grid spacing runs were performed without using  convective schemes, and these runs did a surprisingly good job of showing the derecho in Iowa around 18 UTC 10 August (see Figure). However, the 3- km run performed very poorly because too much convection developed the night before, eliminating nearly all of the Convective Available Potential Energy (CAPE) in Iowa when the actual event occurred. This result is surprising because the FV3-LAM run was driven by initial and lateral boundary conditions from the successful 00 UTC HRRR-experimental run that did not experience this problem. When convective schemes were turned on, the 13-km results did not change noticeably, but the 25-km results were much worse, suggesting the schemes were very active at 25 km but inactive at 13 km.

More quantitative comparisons will soon be performed using MET to obtain some traditional skill measures, and MODE to focus on the convective systems of interest. I also plan to implement FV3-LAM on the supercomputer at my own university, and will be using it to explore upscale convective growth and morphology evolution in my own research.


William Gallus Jr

William Gallus is a professor of meteorology at Iowa State University, where he has been since 1995.  His research focuses on improved understanding and forecasting of convective systems, particularly their rainfall and evolution, through the use of convection-allowing model simulations.  He teaches courses on synoptic and mesoscale meteorology and has won several teaching awards at Iowa State.  When he isn't studying thunderstorms and severe weather, he can be found tending his garden, playing piano, hiking, and chasing tornadoes.

Boreal Scientific Computing Mobile Headquarters

Visitor: Don Morton

Spring 2021


My projects with the DTC Visitor Program have been high points in my 30+ year career as a computational scientist interested in atmospheric sciences.  In 1986 as a Staff Sergeant in the United States Air Force, I discovered my deep interest and aptitude in computer science, and uncovered a new fascination with science, especially the geophysical kind. It inspired me to chart a course towards finally finishing my BS degree and explore graduate school with the notion of applying supercomputing to atmospheric science. From the beginning, I had this view of NCAR as a highly respected institution, but wasn’t sure I ever really envisioned myself spending time there.

Fourteen years later, my first DTC visit was 2010-2011; my research focused on the enhancement of prototype HRRR Alaska NWP forecasts we had been performing at the University of Alaska’s Arctic Region Supercomputing Center (ARSC). We had been running the HRRR-AK multiple times per day, and identified a need for tools that would allow us to build custom products to compare forecasts with observations using the Model Evaluation Tools (MET) and Gridpoint Statistical Interpolation (GSI) software for data assimilation. For a deeper dive on this project, take a look at the report. 


Don Morton

The second DTC project grew its roots during an enlightening meeting I had with Geoff DiMego, then Chief, Mesoscale Modeling Branch at NOAA, in 2009.  During this time, I learned of the evolving NOAA Environmental Modeling System / Nonhydrostatic Multiscale Model on the B-grid (NEMS-NMMB) development and deployment in the NCEP operational environments, and became curious  about how we might apply this research to our own Alaska weather-modeling efforts. I teamed up with Dr. Dèlia Arnold, a scientific consultant with Vienna, Austria’s Zentralanstalt für Meteorologie und Geodynamik (ZAMG). The primary focus for our project was to explore the deployment of NEMS/NMMB to a non-NCEP environment for potential future community use.  

The great challenges were adapting the NEMS/NMMB — which had been explored primarily on NOAA systems using Intel compilers — to a broader collection of computing platforms and regional model domains. Through a concerted  effort, we were able to port the system to Gnu-based Linux environments ranging from typical workstations to Cray supercomputers, and NCAR’s Yellowstone. We also explored the creation of regional simulations over Alaska and Catalonia and launched a temporary NEMS/NMMB Alaska region real-time forecast system — using many of our existing HRRR-AK workflow programs to drive this — on the Cray XK6m at the University of Alaska Fairbanks Arctic Region Supercomputing Center. If you’re curious about how this project moved forward, read the story here.  


Volcano eruptions tend to be one-time, unscheduled events. Figuring out where the ash will go is a time-critical event, with financial impacts in hundreds of billions USD in air transport.

In 2020, I commenced my current DTC project, which in many ways, has roots dating back to the turn of the century when I started collaborating with “The Grid” community.  Of particular interest for me back then was the potential of The Grid to make complex and computationally intensive models available to Joe or Jane Scientist, while avoiding  the complexities of command lines, operating systems, etc. The vision was that users would go to a web page, specify parameters, etc. through an intuitive GUI, and launch the job, not necessarily knowing or caring how and where the model was actually being executed.  

The vision is ambitious, and the specific outcomes for the DTC project include the development of low-level command-line tools that will allow users to create custom and complex NWP workflows by using the DTC NWP Docker containers as loosely-coupled independent software services deployed in the Amazon Cloud.

So, I find myself approaching the end of a mostly enjoyable and fascinating career, having had the wonderful opportunity to serve DTC and the wider NWP community to make some inroads toward realizing this vision.  The project is ongoing, and a recent status update was presented at the 2021 UCAR Software Engineering Assembly’s Improving Scientific Software Conference.

After more than thirty years in the academic world, Don currently spends his time living in Interior Alaska as owner/manager of the single-member LLC, Boreal Scientific Computing, pursuing research and development activities.


Figure above: Don's Boreal Scientific Computing Headquarters with a moose out front.

DTC Visitor Program Xuguang Wang

VIsitor: Xuguang Wang

Winter 2021

Dr. Xuguang Wang is a Robert Lowry Chair Professor and Presidential Research Professor of School of Meteorology of University of Oklahoma. She leads a Multiscale data Assimilation and Predictability (MAP) lab. Her MAP research includes (a) developing new techniques and novel methodologies for data assimilation and ensemble prediction; (b) applying these techniques for global, hurricane, and convective-scale numerical prediction systems that assimilate a variety of in-situ and remote-sensing observations to improve predictive skill; (c) improving the understanding of atmospheric predictability and dynamics through data assimilation and ensemble approaches from global to storm scales; and (d) interdisciplinary research such as leveraging machine learning to improve data assimilation and ensemble prediction. 

Over the past 10+ years, Dr. Wang and her MAP team have been actively working on transitioning their data-assimilation research and development on hybrid 3D and 4D EnVar into NOAA NWS operational numerical weather-prediction systems: GFS, HWRF, and HRRR, in collaboration with NOAA research and operational centers.  Dr. Wang is also excited about cultivating the next generation in data assimilation.  So far she has directly advised 25 students and 19 postdocs on data-assimilation research during her tenure at OU.

Close collaboration with NOAA research and operation centers is essential for effective research-to-operation (R2O) transitioning. While regular research grants typically only enable short visits to collaborate, the DTC Visitor Program allowed Dr. Wang a lengthier visit at NOAA/NCEP/EMC during her sabbatical in Fall 2018. The visit was hosted by Dr. Vijay Tallapragada, chief of the Modeling and Data Assimilation Branch of EMC. The objectives of her visit were to collaborate further with EMC scientists on data-assimilation research and development, and to facilitate the transition of recent data assimilation development of her MAP team into NWS operational global, hurricane and convective-scale prediction systems. During her visit, Dr. Wang also discussed new ways to broaden collaboration between academia and NOAA with the late Dr. Bill Lapenta, then NCEP director, and Dr. Brian Gross, EMC director. 


Using the simultaneous multiscale data assimilation approach in 4DEnVar significantly improved FV3GFS forecast. Adapted from Fig. 8 of Huang, Wang, Kleist and Lei 2020.


The visit accelerated the development of a multiscale data-assimilation approach in the 4DEnVar data assimilation system for the UFS Medium-Range Weather Application (Huang et al. 2020). This approach allows more effective updating of all resolved scales using all observations at once and therefore improves global forecasts (Fig. 1 below).  The visit also expedited transitioning the capability of directly assimilating ground-based radar observation developed by MAP into the operational HRRR (Johnson et al. 2015, Wang and Wang 2017), and the operational HWRF (Lu et al. 2017). Beginning in 2020, these direct ground-based radar data-assimilation capabilities became operational in HRRR and HWRF, as a result of multi-institutional collaboration (OU/MAP, NOAA/NCEP/EMC, NOAA/ESRL/GSL and NOAA/AOML/HRD). These capabilities will be further integrated with the UFS hurricane and convection-allowing modeling (CAM) applications down the road.

Looking into the future, Dr. Wang and her research team at OU plan to continue their basic research to develop novel data-assimilation algorithms that treat non-Gaussianity, new multiscale data-assimilation algorithms (Wang et al. 2020) for weather, and assimilation at the interface between different earth-system components (i.e. coupled data assimilation). They will extend their research and development to enable the effective assimilation of in situ, radar and satellite observations. They will further their work with operational NWP agencies to broaden the impact of basic research through effective R2O. Training the next-generation workforce is critically important for advancing the entire data assimilation field.  Dr. Wang strives to continue advancing this effort by advising students and early career scientists.


Xuguang Wang

Assessing the FV3-LAM Data Assimilation Capability to Represent Convection

Visitor: Ivette Hernández Baños

Autumn 2020
Ivette Hernández Baños

As part of the Unified Forecast System (UFS) effort, a Limited Area Model (LAM) is under development, based on the non-hydrostatic Finite­ Volume Cubed-Sphere Dynamical Core (FV3), to achieve high-resolution forecasts. This project leverages the available environment provided by current UFS developments to investigate the Rapid Refresh Forecast System (RRFS) skill in representing the structure of convection generated by squall lines over the Great Plains of the United States. 

Squall lines occur with a high frequency in this region, causing severe weather events and much of the precipitation that falls there throughout the year. A pre-frontal squall line over Oklahoma on 4 May 2020 is the case under study. Convective initiation was observed over northeastern Oklahoma at 20Z and around 22Z a line of storms evolved that extended across the state (Fig. 1), resulting in several high-wind and large-hail events.


Figure 1. Composite reflectivity (dBZ) observed at 20Z (A) and at 22Z (B) on 4 May 2020. The color bars are the National Weather Service standard color scale for composite reflectivity ranging from 5 to over 75 dBZ. Source: https://hwt.nssl.noaa.gov/sfe_viewer/2020/model_comparisons

The Gridpoint Statistical Interpolation (GSI)  data assimilation (DA) system was used for the analysis and the Model Evaluation Tools (MET) for verification. The GSI 3-dimensional variational (3DVAR) DA capability was tested, along with two physics suites: GFS-based physics and the suite developed at NOAA’s Global Systems Laboratory (GSD SAR). Hourly cycles with 18-hour forecasts starting at 00Z on May 4th through 06Z, May 5th were performed. 

Results from the 2-h forecast initialized at 18Z suggest that the GSD SAR suite with DA experiment was able to represent the initial convection over northeast Oklahoma (see black circles in Fig. 1-A and 2-B), but forecast cycles prior to that initialized at 17Z failed to capture the initial convection over Oklahoma at 20Z (not shown). Experiments using the GFS suite performed poorly for the convective initiation over Oklahoma up to the 20Z valid hour (Fig. 2-D).


Figure 2. 2-h composite reflectivity (dBZ) forecast initialized at 18Z from the experiments using GSD SAR and GFS physics suite without DA, GSD SAR NoDA and GFS NoDA experiments, respectively (A and C), and with 3DVar DA, GSD SAR and GFS experiments respectively (B and D), valid at 20Z on May 4th.

Although more convection developed over other states, a slightly better representation of the squall-line structure is shown after 21Z in the experiments using the GFS suite when compared to the GSD SAR experiments, especially when using DA (Fig. 3-D). The experiments using the GSD SAR suite do not reproduce the evolution of the squall line over Oklahoma and instead, a line of storms developed northward of the observed one (Fig. 3-A and 3-B). After 22Z, the GFS experiments continue to do a better job capturing the squall line structure over Oklahoma while the GSD SAR experiments miss this system until the last cycle. Nevertheless, the convection over Arkansas, Missouri and Illinois is better captured in the experiment using the GSD SAR suite with DA.


Figure 3. 4-h composite reflectivity (dBZ) forecast initialized at 18Z from the experiments using GSD SAR and GFS physics suite without DA, GSD SAR NoDA and GFS NoDA experiments respectively (A and C), and with 3DVar DA, GSD SAR and GFS experiments respectively (B and D), valid at 22Z.

The forecasted 2-m temperature provides further insight into strengths and weaknesses of the configurations in each experiment. Larger bias is observed with longer forecast length when using the GSD SAR suite (Fig. 4-A). After the 5-h forecast, the 2-m temperature forecasts are cooler than the observations by up to 1.74 K. A high positive DA impact is observed for RMSE results up to the 8-hour forecast, after which the impact becomes negative (Fig. 4-B). The forecasts generated using the GFS physics suite have a RMSE and bias that are generally smaller than those associated with the GSD physics suite. The inclusion of DA reduces the bias for all lead times and reduces the RMSE but only during the first 4 hours of the forecast.


Figure 4. Bias (A) and RMSE (B) for 2-m temperatures at each hour forecast averaged over the 31 executed cycles. The dark green and lime lines represent results for experiments with 3DVar DA using GFS and GSD SAR physics suites, respectively, and results for GFS NoDA and GSD SAR NoDA experiments are shown by the black and maroon lines, respectively.

To understand the elements that are limiting the initiation and overproduction of convection in GFS experiments and the convection evolution in the GSD SAR experiments, future work will test the GSI hybrid (3DEnVar) analysis and adjust parameters related to cloud analysis and surface-data analysis enhancements. 

 This visitor project forms part of my doctoral research at CPTEC/INPE (Brazil) and has been underway since March 2020. I am grateful to the DTC for this opportunity, especially to Louisa Nance, Ming Hu, Guoqing Ge, Will Mayfield, Eric Gilleland, Jacob Carley, Daryl Kleist, and my academic advisor Luiz Fernando Sapucci, for their guidance and support during this time. 

The impacts of including aerosols in the radiance observation operator on analysis using GSI

Visitor: Shih-Wei Wei

Summer 2020

Background 

The Gridpoint Statistical Interpolation (GSI) is a variational data assimilation system (DAS) used by several operational centers. GSI is used by NASA’s Goddard Earth Observing System Model, Version 5 (GEOS-5), as well as NOAA’s Global Forecast System (GFS) and High Resolution Rapid Refresh (HRRR) system. It is also used by the research community for a wide range of applications. The current community version is supported and maintained by the Developmental Testbed Center (DTC; https://dtcenter.org/com-GSI/users/index.php). 

The GSI is able to assimilate observations from conventional and remote sensing instrumentation. For the remote sensing measurements, it provides the functionality to assimilate the retrieval products and the radiances in the form of brightness temperature (BT). To assimilate the radiances directly into GSI, the community radiative transfer model (CRTM) employs the radiance observation operator to calculate the BT of the model state, and uses the adjoint model to translate the first-guess departure of BTs to the analysis fields.  

When using DAS, aerosols are often excluded in the computation of BTs. In reality, aerosols influence the radiative transfer in the atmosphere, including the incoming and outgoing shortwave radiation, and the outgoing terrestrial radiation. The fact that aerosols impact the remote sensing measurements implies that the absence of aerosols in BT simulation may introduce biases into DAS. In the current release of GSI v3.7/CRTM v2.2.6, the functionality to account for the impacts of aerosols on the BT derivation is available. However, it only considers the aerosol species provided by the Goddard Chemistry Aerosol Radiation and Transport (GOCART), which includes five bins for dust, four bins for sea salt, hydrophobic and hydrophilic black and organic carbon, and sulfates.

Planned DTC transition activities

Our visitor project includes two key aspects: (1) add a regression test for the aerosol-enabled radiance observation operator, and (2) investigate the impacts of including aerosols in the radiance observation operator on the analysis fields. Both tasks used the latest master branch of GSI and were conducted on Hera, which is NOAA’s R&D High Performance Computing (HPC) system maintained by the NOAA Environmental Security Computing Center (NESCC)

New regression test

A new regression test (“global_C96_fv3aerorad”) was introduced to ensure the functionality of aerosol-aware BT derivations in GSI/CRTM. This regression test applies the same first-guess files as the regression test for aerosol DA (“global_C96_fv3aero”), which performs the aerosol analysis using satellite aerosol optical depth (AOD) observations on 00Z June 22, 2019. The first-guess files are taken from the aerosol member of the Global Ensemble Forecast System (GEFS-Aerosol v12), which uses the Unified Forecast System FV3 dynamic core coupled with the GOCART aerosol module.  GEFS-Aerosol is slated to replace the current aerosol forecast model by late 2020. The aerosol fields in the first-guess files provide the 3-dimensional multi-speciated aerosol distributions for the BT calculation by CRTM.

Single-cycle GSI experiments

To assess the impact of accounting for aerosols on the GSI analysis, two single-cycle GSI experiments were conducted. These included: (1) the aerosol-blind run (noted as CTL later), which is the baseline GSI, and (2) the aerosol-aware run (noted as AER later), which is the same configuration as the new regression test. 

Figure 1 shows (a) the analyzed temperature difference at 925 hPa between the two experiments, and (b) the total column mass density of the aerosols incorporated into the radiance observation operator. The analyzed temperature differences reveal that when aerosol effects are considered in the derivation of the simulated BT, the air temperatures are adjusted across the globe. The difference in the analyzed temperatures range from -2K to 1K, with the high-latitude regions being the most sensitive to the changes in the simulated BTs. 


Figure 1. (a) Temperature analysis difference at 925 hPa between the AER (aerosol-aware) and the CTL (aerosol-blind) run and (b) the aerosol total column mass density (kg m -2 ). Figures are plotted with Panoply Data Viewer by NASA.


Figure 2 illustrates the impacts on BT after including aerosols in the radiance observation operator. Figure 2a shows the BTs at 10.39 µm from Infrared Atmospheric Sounding Interferometer (IASI) on METOP-A, Figure 2b gives the corresponding BTs simulated in CTL, and Figure 2c shows the simulated BT difference between the two experiments (AER – CTL). The comparison of Figure 2a and 2b show that CTL overestimates BT in several regions, such as the tropical Atlantic Ocean near the Africa coast (~5ºN and 15ºW), the east side of Papua New Guinea, and the Northwest Pacific Ocean near Philippines, and Japan. In these regions, the simulated BTs in AER are cooler than CTL (Figure 2c) which implies a better agreement with the observations. It needs more investigation to address impacts of these aerosol-aware first-guess departures on analysis.

Figure 2d shows the difference in the height of the weighting function peaks between the two experiments (AER – CTL). The peak in the weighting function represents the level that emits most of the radiance received by the sensors. Figure 2d indicates that aerosols affect the level of the peak in the weighting function, which is because the aerosols modify the transmittance profile. The difference in the height of the weighting function remains unchanged for most regions, but can change by as much as 200 hPa in the Antarctic region. This suggests that when considering aerosols in the radiance operator, the different peaks in the weighting function would be generated to the same channel of IASI onboard METOP-A, which will modify the temperature structure in the analysis accordingly.


Figure 2. (a) Observed BT; (b) Simulated BT from the CTL (aerosol-blind); (c) First guess departure difference (AER – CTL) before BC and QC; (d) Difference in the pressure level (hPa) of the peak in weighting function for IASI onboard METOP-A. All the data are from the analysis cycle on 00Z June 22, 2019.


Summary

GSI/CRTM provides the capability of accounting for aerosol effects in the BT derivation. Single-cycle experiments revealed that considering aerosol information in the CRTM radiance operator could introduce cooler simulated BTs, adjustments to the weighting function, and changes to atmospheric temperature analysis. Despite the sensitivities presented in this report, further studies are needed to explore how to incorporate the aerosol information properly through quality control (QC) and bias correction (BC) in DAS. Such efforts are needed to exploit this new option toward enhancing the analysis system and thus, weather forecasting.

Acknowledgment

The author thanks DTC for facilitating this graduate student project, and is very grateful to valuable guidance from Drs. Ming Hu and Guoqing Ge. The author also thanks the input from his academic advisor, Dr. Cheng-Hsuan (Sarah) Lu, and University of Albany colleague, Dr. Dustin Grogan.


Shih-Wei Wei

Evaluating the Impact of Model Physics on Forecasts of Hurricane Rapid Intensification

Visitor: Jun Zhang

Spring 2020

Dr. Jun Zhang, a scientist from the University of Miami and visitor to the DTC in 2018, investigated the impact of model physics on the forecast performance of hurricane models for hurricanes undergoing rapid intensification (RI). Accurate predictions of hurricane intensity could significantly reduce the economic loss, especially if a hurricane makes landfall at well-developed coastal regions. 

Hurricane intensity is influenced not only by environmental factors but also by internal dynamics and thermodynamics. Previous research based on statistical modeling suggested that around 35% of the skill of predicting hurricane RI in the Atlantic basin is explained by processes related to the large-scale environment. What remains challenging is to realistically represent inner-core processes, especially in the physical packages of the hurricane models. As the horizontal resolution of the operational hurricane models such as the Hurricane Weather and Research Forecast (HWRF)  approaches 1.5 km, the performance of physics traditionally used in low-resolution models should be evaluated. Dr. Zhang’s research project focused on evaluating the impact of model physics in HWRF on hurricane RI prediction.

Dr. Zhang worked with DTC staff to design numerical experiments for this project. They created extensive HWRF forecasts with two different cumulus schemes.  The team also decided to use some existing HWRF forecasts from the Environmental Modeling Center (EMC) for evaluating the impacts of other physics on RI prediction.  

Dr. Zhang split the HWRF retrospective forecasts into four groups: captured RI (Hit), missed RI (Miss), and predicted RI with false alarm (False Alarm). For each physics component, he evaluated the model’s performance for RI prediction by building a contingency table that summarizes the number of each group and calculating the Critical Success Index.  For a given component of model physics that shows substantial improvement in the RI forecast, he also conducted a detailed analysis of the TC structure to understand why the changes in model physics make the RI forecast better.  


Horizontal view of convective burst locations during the period between 48 and 53 h of forecast time for HWRF forecasts of Hurricane Earl (2010) initialized at 1200 UTC 27 Aug 2010 with high-Km and low-Km boundary-layer physics. The red arrow indicates the shear direction. The green arrow indicates the tilt direction. Note that Km represents the vertical eddy diffusivity. RMW is the radius of maximum wind speed. This figure is taken from Zhang and Rogers (2019).


By analyzing these HWRF forecasts, Dr. Zhang found that both the cumulus and boundary layer schemes have substantial impact on HWRF’s RI prediction skill, while the impact of horizontal diffusion parameterization is relatively small. His case study of Hurricane Gonzalo (2014) showed that the Grell-Freitas cumulus scheme performs better in terms of hurricane structure forecast than the Simplified Arakawa-Schubert scheme. Another case study of Hurricane Earl (2010) showed that the strength of vertical turbulent mixing in the boundary layer regulates the vortex- and convective-scale structures and their interaction with the environmental wind shear. This multiscale interaction process is found to be crucial for hurricane intensification, which is recommended by Dr. Zhang to be considered in future physics evaluation and upgrades.

Dr. Zhang enjoyed his visit to DTC and found very valuable collaborations with DTC colleagues.  DTC provides a friendly environment for him. DTC scientists are very knowledgeable about model development and verification and provided great support for Dr. Zhang’s project.  The next step of his project is to analyze idealized HWRF simulations created by DTC in order to understand how model physics affects hurricane intensification dynamics. 


Jun Zhang

Using Machine Learning to Post-Process Ensemble-based Precipitation Forecasts

Visitor: Eric Loken

Autumn 2019

Ensembles are useful forecast tools because they account for uncertainties in initial conditions, lateral boundary conditions, and/or model physics, and they provide probabilistic information to users. However, many ensembles suffer from under-dispersion, sub-optimal reliability, and systematic biases. Machine learning (ML) can help remedy these shortcomings by post-processing raw ensemble output. Conceptually, ML identifies (nonlinear and linear) patterns in historical numerical weather prediction (NWP) data during training and uses those patterns to make predictions about the future. My work seeks to answer questions related to the operational implementation of ML for post-processing ensemble-based probabilistic quantitative precipitation forecasts (PQPFs). These questions include how ML-based post-processing impacts different types of ensembles, compares to other post-processing techniques, performs at various precipitation thresholds, and functions with different amounts of training data. 

During the first part of my visit, my work has used a random forest (RF) algorithm to create 24-h PQPFs from two multi-physics, multi-model ensembles: the 8-member convection-allowing High-Resolution Ensemble Forecast System Version 2 (HREFv2) and the 26-member convection-parameterizing Short-Range Ensemble Forecast System (SREF). RF-based PQPFs from each ensemble are compared against raw ensemble and spatially-smoothed PQPFs for a 496-day dataset spanning April 2017 – November 2018. 

Preliminary results suggest that RF-based PQPFs are more accurate when compared to the raw and smoothed ensemble forecasts (Fig. 1). An example set of forecasts for the 1-inch threshold is shown in Fig. 2. Notably, the RF PQPFs have nearly perfect reliability without sacrificing resolution, as sometimes occurs with spatial smoothing (e.g., Fig. 2b). The RF technique performs best for the SREF, presumably because it has more systematic biases than the HREFv2, and for lower precipitation thresholds, since there are more examples of observations exceeding these thresholds (i.e., the RF has more positive training examples to work with).    


Figure 1 (a) Brier Skill Score (BSS) for the raw (purple), spatially smoothed (blue), and RF-based (red) ensemble PQPFs for the 1-inch threshold. (b) As in (a) but for the reliability component of the Brier Score (BS). (c) As in (a) but for the resolution component of the BS.

Figure 2 - Probability of 1-inch threshold exceedance from the SREF-based raw (a), spatially smoothed (b), and (c) RF-based forecasts. The black contour denotes where 1-inch precipitation was observed. (d) - (f) As in (a)-(c) but for HREFv2-derived forecasts.


Once an RF has undergone training, it is computationally inexpensive to run in real-time. After data preprocessing, a real-time forecast can be generated in less than a minute on a single processor. Including preprocessing, the forecast takes about 30 minutes to generate. Real-time RF PQPFs are currently being produced for the 00Z HREFv2 initialization and can be accessed at https://www.spc.noaa.gov/exper/href/ under the precipitation tab.

Future work will add temporal resolution to the ML-based forecasts and will compare the benefits of ML-based post-processing for formally-designed ensembles, whose members use the same physical parameterizations and produce equally-likely solutions (e.g., the NCAR ensemble), and informally-designed ensembles, whose members use different physical parameterizations and produce unequally-likely solutions (e.g., the Storm Scale Ensemble of Opportunity). I am grateful to the DTC Visitor Program for supporting this work. 


Eric Loken

Forecast Skill of the High-Resolution Rapid Refresh (HRRR) Model for Banded Snowfall Events

Visitor: Jacob Radford

Spring 2019

Jacob Radford, a Ph.D. student at North Carolina State University and visitor to the DTC during June of 2018, investigated the forecast skill of the High-Resolution Rapid Refresh (HRRR) model for banded snowfall events. In particular, he evaluated the HRRR’s ability to capture the location, areal extent, orientation, and aspect ratio of these locally enhanced regions of reflectivity. In theory, snowbands should be adequately resolved by the HRRR thanks to its fine grid-spacing, but model skill has not yet been assessed quantitatively.

Snowbands, or narrow regions of intense snowfall, present hazardous travel conditions due to rapid onset, high precipitation rates, and reduced visibility. Though there has been no quantification of the societal or economic impacts associated with snowbands, in particular, the economic costs of heavy snow events are estimated to be in the billions. Furthermore, mesoscale precipitation bands account for a significant portion of annual precipitation and were found to occur in a majority of cold-season precipitation events in the Northeast and Central U.S. Because these snowbands are small in scale, even the mere occurrence of snowbands is difficult to predict, not to mention the timing, location, and intensity. Thus, there is great incentive to improve understanding of the environmental conditions, physical processes, climatologies, and predictability of snowbands.

Jacob utilized the DTC’s Method for Object-based Diagnostic Evaluation (MODE) to match snowbands in the HRRR’s 1000-m reflectivity field to bands in national mosaicked base reflectivity fields. However, snowbands were defined based on local reflectivity heterogeneity rather than a set reflectivity threshold, a capability not possible in the current iteration of MODE. Thus, the primary goal of Jacob’s visit was to enable greater flexibility in MODE object identification. Jacob worked with Model Evaluation Tools (MET) developers Tara Jenson, Jamie Wolff, John Gotway, and Randy Bullock to implement these changes in MODE. The team quickly determined that the most practical way to accomplish this feat was to build a Python interface for MODE, allowing users to define objects in a Python script however they see fit and then input these objects into MODE via Numpy arrays or xarrays. This added functionality is a significant stepping stone for MODE user flexibility and is available as of MET v8.0.

With MET v8.0, Jacob could then define snowbands as a narrow region of reflectivity at least 1.25 standard deviations above the local reflectivity background, identified in HRRR-simulated and observed reflectivity, and matched with MODE based on similarity in location, area, orientation angle, and aspect ratio. The distributions of interest scores, or measures of the observation/forecast similarities based on these four properties, are shown in Fig. 1. The median interest score of 0.66 indicates that while the HRRR demonstrates some ability to match observed snowband cases, there are significant errors in at least two of the four interest parameters. Applying a cutoff of 0.70 to correspond to a reasonably well-forecasted case, only 30% of cases were well-forecasted by the HRRR. Ultimately, while the HRRR may be helpful in identifying areas of heightened snowband risk, it lacks forecast precision in location and timing. The next step in this work will be to apply a similar verification procedure to the HRRR ensemble to evaluate probabilistic snowband forecast skill.


Figure 1: Distribution of interest scores between HRRR-forecasted and observed band objects.


Jacob found collaboration with the DTC to be an extremely valuable experience vital to the completion of his Master’s research and a step towards his Ph.D. Everyone at the DTC was extremely friendly, accommodating, and knowledgeable about forecast verification. While Jacob wasn’t at the DTC, he spent his time exploring the Flatirons and Rocky Mountain National Park.


Jacob hiking the trails of Rocky Mountain National Park during one of his weekends in CO.

Impact of Vertical Advection Schemes of the Hydrometeors on the Simulated Hurricane Structure and Intensity

Visitor: Shaowu Bao

Summer 2018

Advection is a computationally expensive process in Numerical Weather Prediction (NWP) models. Therefore, time-sensitive operational forecast models sometimes sum up the hydrometeors, including cloud water, rainwater, ice and snow, prior to calling the advection scheme. For this configuration, the model only needs to calculate the advection of the total condensate. However, the impact of such a time-saving technique has not been systematically evaluated. With the release of HWRF 3.9a, a version of the operational HWRF microphysics scheme with separate hydrometeor advection became available to the research community, providing an excellent opportunity to study how simulated hurricane structures differ according to the advection schemes they use.  As a DTC Visitor, Shaowu Bao evaluated the impact of vertical advection schemes of the hydrometeors on the simulated hurricane structure and intensity in the Hurricane Weather Research and Forecasting (HWRF) model.

Hurricanes Matthew (2016) Hermine (2016) and Jimena (2015) were simulated using the operational HWRF 2017 with the advection of total condensate (hereinafter T_ADV) and that of separate hydrometeors (hereinafter S_ADV). Their results were then compared against the infrared (IR) brightness temperature images data from NOAA's Geostationary Operational Environmental Satellite GOES 13.

The most distinct difference between the T_ADV and S_ADV results was the simulated storm size. In Figure 1, a deep blue IR brightness temperature indicates a cold cloud top and red-brown identifies the warm surface of the Earth with no-cloud or fewer cloud conditions. T_ADV and S_ADV produced similar storm locations and shapes that both matched the observed. However,  S_ADV produced cloud coverage that was noticeably larger than that produced by T_ADV.

Figure 1: IR brightness temperature for Hurricane Hermine at 18Z 09/01/2016 for a) observed and 36-h forecast with b) total condensate advection and c) separate hydrometeor advection
Figure 1: IR brightness temperature for Hurricane Hermine at 18Z 09/01/2016 for a) observed and 36-h forecast with b) total condensate advection and c) separate hydrometeor advection.

Our hypothesis suggests the total condensate advection in T_ADV overestimates the upward advection of rainwater and underestimates that of cloud water. By correcting this problem, the S_ADV scheme transports more cloud water upward than T_ADV, leading to more diabatic heating from condensation and more angular momentum to be imported into the hurricane vortex. This causes the larger size of hurricanes simulated by S_ADV than those by T_ADV. Our results of the angular momentum (Figure 2) and other analysis confirmed this hypothesis.

Figure 2: Pressure-radial cross-section of the azimuthally averaged angular momentum in T_ADV (left) and S_ADV (right) for the simulation of hurricane Matthew 2016 14L 2016100100 cycle valid at 96h
Figure 2: Pressure-radial cross-section of the azimuthally averaged angular momentum in T_ADV (left) and S_ADV (right) for the simulation of hurricane Matthew 2016 14L 2016100100 cycle valid at 96h.

Although in theory the separate advection of hydrometeors in S_ADV is more realistic than the advection of total condensate in T_ADV, this evaluation showed that S_ADV simulated much larger storms than T_ADV and the observed hurricanes, and therefore degraded the HWRF performance. Future work is needed to identify the adjustments in the model that may have masked the error related to the total condensate advection, so that the separate hydrometeors advection can achieve better forecast performance.

Shaowu found that the two weeks spent at NCAR collaborating with DTC scientists was a very pleasant and productive experience. He wants to especially thank Ligia Bernardet, Evan Kalina, Mrinal Biswas, Greg Thompson and Louisa Nance, as well as Kathryn Newman. Without their help and support setting up the model, providing input data, and analyzing the results, this project was impossible to complete.


Shaowu Bao

Variational lightning data assimilation in GSI

Visitor: Milija Zupanski

Spring 2018
A contribution by Karina Apodaca and coauthor Milija Zupanski on the work they conducted with the DTC Visitor Program on variational lightening data assimilation. This article covers highlights of their journal article. See, also, the link at the end of this article.

The launch of new observing systems offers tremendous potential to advance the operational weather forecasting enterprise. However, “mission success” is strongly tied to the ability of data assimilation systems to process new observations. One example is making the most of new measurements of lightning activity by the Geostationary Lightning Mapper (GLM) instrument aboard the GOES-16 satellite. The GLM offers the possibility of monitoring lightning activity on a global scale. Even though its resolution is significantly coarser, as compared to ground-based lightning detection networks, its measurements of lightning can be particularly useful in less observed regions such as elevated terrain or open oceans. The GLM identifies changes in an optical scene, which are indicative of the presence of lightning activity, and produces “pictures” that can provide estimates of the frequency, location, and extent of lightning strikes. How can we capitalize on the information provided by these pictures of lightning events for the benefit of operational numerical weather prediction models and in particular at the NOAA/National Weather Service?

We enhanced the NCEP operational Gridpoint Statistical Interpolation (GSI) system within the GLobal Data Assimilation SYstem (GDAS) by adding a new lightning flash rate observation operator and by following a variational data assimilation framework. Given the coarse resolution and simplified microphysics of the current operational global forecasting system, we designed this new lightning flash rate observation operator to update large-scale model fields such as humidity, temp, pressure, and wind.

To start, we used surface-based Lightning Detection Network (LDN) data from the World Wide Lightning Location Network as a GLM-proxy (Fig 1a). Real-Earth latitude, longitude, and timing of total lightning strikes were extracted in a way similar to what the GLM instrument measures. These data were then converted into BUFR (a binary data format) required for assimilation by the GSI system and ingested as a cumulative count of geo-located lightning strikes (Fig 1b). This lightning assimilation package has been prepared to handle actual GLM observations once they are well-curated, suitable for testing, and readily available to the public.

The lightning assimilation package has been fully incorporated in a version of the GSI system and is being evaluated by the GSI review committee. We are now verifying the effects of lightning observations on the forecast through global parallel experiments with the NCEP/4DEnVar system. Thus far, an assessment of the processing of lightning observations and the impacts on the initial conditions for some of the dynamical fields of the GFS model seems promising. The analyses increments of temperature, pressure, humidity, and winds shown in  Fig. 1 (c, d, e, and f), and the location of the raw lightning strikes coincide with the location of the high-precipitation contours in Fig. 2.

In preparation for the NOAA/NGGPS FV3-based Unified Modeling System, we hope to further develop this lightning capability for the GOES GLM instrument following a hybrid (EnVar) methodology and by incorporating a cloud-resolving/non-hydrostatic-suitable observation operator for lightning flash rate capable of also updating cloud hydrometeor fields. Once GLM observations are available, we will evaluate their actual impact with GSI system and assess their benefit in operational weather prediction at NCEP.

More information see the Joint Center for Satellite Data Assimilation Quarterly, No. 58, Winter 2018, JCDSA: ftp://ftp.library.noaa.gov/noaa_documents.lib/NESDIS/JCSDA_quarterly/no_58_2018.pdf#page=12


Figure 1. (a) Raw lightning observations from the WWLLN network, (b) assimilated lightning flash rate, both valid at 12 UTC 27 August 2013. Analysis increments of (c) temperature (K), (d) u-component of wind (m/s), (e) v-component of wind (m/s), and (f) specific humidity (g/kg) from a GFS/GDAS lightning data assimilation experiment.

Figure 2. 24-hr precipitation valid at 2013-08-27_12:00:00 (Courtesy: NWS). Note the region of maximum precipitation near the Arizona-Nevada border, which coincides with the region of a positive analysis increment in specific humidity shown in Fig. 2. The assimilation of lightning observations has a positive impact in the initial conditions of the GFS model.

Are mixed physics helpful in a convection-allowing ensemble?

Visitor: William "Bill" Gallus, Jr

Autumn 2017

As a 2017 DTC visitor, William Gallus is using the Community Leveraged Unified Ensemble (CLUE) output from the 2016 NOAA Hazardous Weather Testbed Spring Experiment to study the impact of mixed physics in a convection-allowing ensemble.  Two of the 2016 CLUE ensembles were similar in their use of mixed initial and lateral boundary conditions (at the side edges of the model domain), but one of them also added mixed physics, using four different microphysics schemes and three different planetary boundary layer schemes.

Traditionally, ensembles have used mixed initial and lateral boundary conditions. Their perturbations generally resulted in members equally likely to verify; a good quality in ensembles.  However, as horizontal grid spacing was refined and the focus of forecasts shifted to convective precipitation, studies suggested that problems with insufficient spread might be alleviated through the use of mixed physics.  Although spread often did increase, rules of well-designed ensemble approaches were violated such as biases related to the particular physics schemes, and in some cases members that were more likely to verify than others. Improved approaches for generating mixed initial and lateral boundary conditions for use in high-resolution models now prompt the question – is there any advantage to using mixed physics in the design of an ensemble?


Bill Gallus

To explore the impact of mixed physics, the Meteorological Evaluation Tools (MET) has been run for 18 members of the two ensembles for 20 cases that occurred in May and early June 2016.  Standard point-to-point verification metrics such as Gilbert Skill Score (GSS) and Bias are being evaluated for hourly and 3-hourly precipitation and hourly reflectivity.  In addition, Method for Object-Based Diagnostic Evaluation (MODE) attributes are being compared among the nine members of each ensemble.  

Preliminary results suggest that more spread is present in the ensemble that used mixed physics, and that the median values of convective system precipitation and reflectivity are closer to the observed values.  However, the median values are achieved by having a few members with unreasonably large high biases that are balanced by a larger set of members suffering from systematic low biases.  Is such an ensemble the best guidance for forecasters?

Accumulated measures of error from each member would suggest that the ensemble using mixed physics performs more poorly.  The figure shows an example of the 90th percentile value of reflectivity among the systems identified by MODE as a function of forecast hour for the nine members examined in both ensembles.  Additional work is needed along with communication with forecasters to determine which type of ensemble has the most value for those who interpret the guidance.

MET output and how the ensembles depicted convective initiation are also being examined, along with an enhanced focus on systematic biases present in different microphysical schemes.  It is hoped that the results of this project will influence the design of the 2018 CLUE ensemble and that future operational ensembles used to predict thunderstorms and severe weather can be tailored in the best way possible.  This visit has been an especially nice one for Dr. Gallus since he had done several DTC visits about ten years ago when the program was new, so the experience feels a little like “coming home”!  The DTC staff are always incredibly helpful, and the visits are a great way to become familiar with many useful new research tools. Universities can become a bit like ghost towns in the summer, so he also enjoys the chance to get away to Boulder, with its more comfortable climate, great opportunities to be outdoors, numerous healthy places to eat, and opportunities to interact with the many scientists at NCAR.

Dr. Gallus is a meteorology professor at Iowa State University whose research has often focused on improved understanding and forecasting of convective systems. The CLUE output was provided by Dr. Adam Clark from NSSL, while observed rainfall, reflectivity, and storm rotation data were gathered by Jamie Wolff at the DTC, who is serving as his host, and Dr. Patrick Skinner from NSSL who is also working with CLUE output as a DTC visitor this year.   Dr. Gallus is also working closely with John Halley-Gotway at the DTC who has provided extensive assistance with model verification via the MET and METViewer tools.


The 90th percentile reflectivity values from forecast hour 6 through 30 for the nine members studied in the single physics ensemble (top) and the ensemble that includes mixed physics (bottom). Both ensembles use mixed initial and lateral boundary conditions. The red curve is the control member (common to both ensembles) and the black curve identifies the observed values.

Cloud Overlap Influences on Tropical Cyclone Evolution

Visitors: Michael Iacono and John Henderson

Winter 2017

As visitors to the DTC in 2016, Michael Iacono and John Henderson of Atmospheric and Environmental Research (AER) used the Hurricane Weather Research and Forecasting model (HWRF) to investigate an improved way of representing the vertical overlap of partial cloudiness and showed that this process strongly influences the transfer of radiation in the atmosphere and can impact the evolution of simulated tropical cyclones.

Clouds are a critical element of Earth’s climate because they strongly affect both the incoming solar (or shortwave) energy, which fuels the climate system, and the thermal (or longwave) energy passing through the atmosphere. Understanding the way that clouds absorb, emit, and scatter radiation is essential to modeling their role effectively.

One limitation to simulating clouds accurately is the challenge of representing their variability on scales smaller than the typical grid spacing of a dynamical model such as HWRF. Individual cloud elements are often sub-grid in size, and radiative transfer through fractional clouds strongly depends on whether they are vertically correlated such as for deep, convective clouds, or uncorrelated such as for randomly situated shallow cumulus under high clouds.


Height by longitude (west to east) cross-section of longwave radiative heating rate through the eye of Hurricane Joaquin as simulated by HWRF using different cloud overlap methods. The x-axis spans roughly ten degrees of longitude across the HWRF inner domain, and the linear vertical scale extends from the surface to the model top at 2 hPa while emphasizing the troposphere.

Using the Rapid Radiative Transfer Model for Global Climate Models (RRTMG) radiation code in HWRF, the primary objective of this project is to examine the effect of replacing the default maximum-random (MR) cloud overlap assumption with an exponential-random (ER) method, which has been shown to be more realistic relative to radar measurements within vertically deep clouds. The MR approach forces a condition of maximal overlap throughout adjacent partly cloudy layers, while the ER method relaxes this restriction by allowing the correlation to transition exponentially from maximum to random with vertical distance through the cloudy layers.

A first step in assessing this change in HWRF is to show that it alters radiative heating rates enough to affect the development of a tropical cyclone (TC), since heating rates, along with surface fluxes, are the primary means by which a radiation code influences a dynamical model. For Hurricane Joaquin, a 2015 Atlantic basin storm with an unusual track that was challenging to predict, each overlap method causes longwave and shortwave heating rates to evolve very differently within and near the storm over multiple five-day HWRF forecast cycles. Over time, these changes modify the temperature, moisture and wind fields that exert a considerable influence on the predicted strength and movement of Joaquin.


HWRF five-day forecasts of Hurricane Joaquin track for the 2015 operational model (green) and the DTC/HWRF 2016 model using MR cloud overlap (blue) and ER cloud overlap (red) relative to the best-track observed position (white).

The full impact on TC track and intensity remains under investigation, since the cases studied to date respond very differently. Hurricane Joaquin track forecasts are dramatically altered in some forecast cycles, while more modest track changes are seen for storms embedded in strong steering flows such as East Pacific Hurricane Dolores from 2015 and Atlantic Hurricane Gonzalo from 2014. Intensity impacts are also case-dependent with improvement seen in some Joaquin forecast cycles and degraded intensity forecasts in other cases.

Our interaction with the DTC was a rewarding opportunity to acquire new insights on this topic, and we will pursue further research collaborations with the DTC and the NOAA/EMC Hurricane Team in the future.

Evaluating Convective Structure

Visitor: Mariusz Starzec

Summer 2017

As a visitor to DTC in 2016, University of North Dakota Ph.D. candidate Mariusz Starzec investigated the performance of regional summertime convective forecasts. In particular, he focused on model skill in predicting the coverage, morphology, and intensity of convection. Further emphasis was placed on how representative the simulated internal convective structure is of observed convection by using the reflectivity field as proxy for convective processes.

Convection plays a major role in everyday weather and long term climate. Any biases present in convective forecasts have important implications on the accuracy of operational forecasts, potential severe weather hazards, and climatic feedbacks. Validation of model forecasts are required to identify if any of these biases exist.

For the DTC project, four months of forecasts from six 3-km Weather Research and Forecasting (WRF) model configurations were assessed, where one of the configuration was the High Resolution Rapid Refresh (HRRR). The WRF configurations consisted of a combination of varying microphysics and model versions. The simulated reflectivity field was compared against the radar-observed reflectivity field, which is an instantaneous snapshot into what is occurring in the convective system. More importantly, this approach allows for the entire three-dimensional vertical structure of convective systems to be evaluated.


Total area of discrete objects above 45 dBZ with height for a variety of models simulations (colored) and observations (black).

Forecasts were analyzed using an object-based approach, where bulk attributes of discrete storm cells are emphasized instead of exact timing and location. Object counts and their respective areas with height were evaluated, along with the vertical distribution of reflectivity values within these objects. Overall, convective forecasts were generally more intense, contained more and larger objects, and covered more area than observed convection. The largest over-predictions occurred during the peak in the diurnal cycle. No major differences were found between model versions, although varying the microphysics caused large differences in the vertical distributions of object counts and areas.

Vertical distributions of reflectivity in forecasted and observed objects showed that simulated convection has a wider distribution of reflectivity values, especially aloft (>5 km). In general, reflectivity distributions were overly intense by 5-10 dBZ and reflectivity magnitudes in the melting layer were frequently and notably over-pronounced. A further inter-comparison of the model physics and versions revealed that although minor differences can be found near the surface at 1 and 2 km, major differences in convective structure can be found aloft.


Contoured Frequency by Altitude Diagrams (CFADs) of reflectivity within 45 dBZ objects present at 2 km for a sample model dataset (left) and radar dataset (middle). The difference in frequency between the model and radar CFAD (right), where higher model frequency is red.

One of the findings of this project indicates that it is important to validate forecasts at multiple heights, as evaluation of model fields at one level may not reveal any biases. More research is required into three-dimensional model verification, so new verification tools and algorithms that can accomplish such tasks are needed.

Mariusz was hosted by Tara Jensen and found that traveling to NCAR and collaborating with DTC was an invaluable learning experience, and he enjoyed getting to meet everyone and learn about their research. Outside of the DTC project, he had fun exploring around Boulder and hiking as many trails as possible in both the foothills and the Rockies.


Mariusz Starzec enjoying a trail with a backdrop of Mount Meeker and Longs Peak.

DTC Visitor Project

Visitor: Liantang Deng

Spring 2016

This winter of 2015-2016, the DTC had the pleasure of hosting visiting scientist Dr. Liantang Deng of the Numerical Weather Prediction Center, China Meteorological Administration (CMA). His visit stemmed from the combined Weather Research and Forecasting (WRF) and Global/Regional Assimilation and PrEdiction System (GRAPES) modeling workshop in 2014, when Dr. Bill Kuo, Director of the DTC, helped facilitate interactions between the DTC and CMA. During his 2-month stay, he evaluated the GRAPES model by utilizing baseline data sets within the Mesoscale Model Evaluation Testbed (MMET), a framework established by the DTC to assist the research community in efficiently demonstrating the merits of new developments.


Composite reflectivity of the a) ARW and b) GRAPES model at forecast hour 36. The red oval is the location of the observed derecho as shown in the radar observation inset in the upper-left corner.

Dr. Deng’s testing focused on the historic derecho case of 29 June 2012, which impacted many states in the Mid-western and Mid-Atlantic regions. The GRAPES model domain and forecast period were set up similarly to the MMET baseline 12-km parent domain, which covers the full CONUS region, and is integrated out to 84 hours; the initial and boundary conditions were derived from the GFS at 12 UTC on 28 June 2012. For Dr. Deng’s visit, he focused on the Advanced Research WRF (ARW) baseline, which was initialized with NAM and run with the operational Rapid Refresh (RAP) physics suite.

Post-processing of the GRAPES model output was conducted using the NCEP Unified Post-Processing (UPP) software. Even though UPP does not currently support the GRAPES model, Dr. Deng worked diligently to add and modify routines necessary for proper I/O, including addressing the vertical and horizontal grid-staggering, as well as addressing routines for select post-processed fields. These modifications are a welcome addition to UPP and can potentially be released as a community contribution in a future release. After the post-processing step, the DTC’s Model Evaluation Tools (MET) were used for the verification process and included statistical results for surface and upper-air point observations, as well as gridded precipitation observations.


Frequency Bias of 03-h accumulated precipitation over the Midwest region for the 36-h forecast lead time.

Although the GRAPES model was able to resolve a storm over the Midwest, the timing was behind and the location was too far north (Figure b). The strong leading edge observed in the storm did not form in the model, and it weakened as is moved eastward. This, compared to the ARW baseline failed to capture the event (Figure a), illustrating the impact of the different physics suites and different initial and lateral boundary conditions have on the model forecasts. The ARW initiated a storm, but instead of strengthening as it moved eastward across the Midwest, it actually dissipated. GRAPES formed a storm but was not accurate in timing, location, or forming the strong leading edge. A look at the 3-hour accumulated precipitation frequency bias at the 36 hour lead time over the Midwest (Figure below) shows a small high bias at the lowest thresholds, transitioning to a small low bias at higher thresholds, with exception of the highest threshold. This plot shows that even though the timing and location of the storm were off, GRAPES did a decent job of forecasting the accumulated precip amounts (with a little over prediction of the low thresholds and underprediction of higher thresholds).

Dr. Deng was very grateful to collaborate with the DTC and was surprised at how much he was able to accomplish in his short visit. We here at the DTC enjoyed working with him and would welcome him back for future visits to continue his work.


Liantang Deng

Implementation and Validation of a Geo-Statistical Observation Operator for the Assimilation of Near Surface Winds in GSI

Visitor: Joël Bédard

Winter 2016

As a 2015 DTC visitor, Joël Bédard is working with Josh Hacker to apply a geo-statistical observation operator for the assimilation of near-surface winds in GSI for the NCEP Rapid Refresh (RAP) regional forecasting system.

Biases and representativeness errors limit the global influence of near-surface wind observations. Although many near-surface wind observations over land are available from the global observing system, they had not been used in data assimilation systems until recently and many are still unused. Winds from small islands, sub-grid scale headlands and tropical lands are still excluded from the UK Met Office data assimilation system, while other operational systems simply blacklist wind observations from land stations (e.g. Environment Canada). Similarly, the RAP systems uses strict quality control checks to prevent degrading the near-surface wind analysis due to representativeness errors.

Model Output Statistics (MOS) methods are often used for forecast post-processing, and Bédard et al. previously evaluated MOS for use in the data assimilation. Doing so increases the consistency between observations, analyses and forecasts. They also addressed representativeness and systematic error issues by developing a geo-statistical observation operator based on a multiple grid-point approach called GMOS (Geophysical Model Output Statistics). The idea behind this operator is that the nearest grid-points, or a simple interpolation of the surrounding grid-points, may not represent conditions at an observing station, especially if the station is located on complex terrain or coastal site. On the other hand, amongst the surrounding grid-points, there are generally one or several grid-points that are more representative of the observing site. Thus, GMOS uses a set of geo-statistical weights relating the closest NWP grid-points to the observation site. GMOS takes advantage of the correlation between resolved scales and unresolved scales to correct the stationary and isotropic components of the systematic and representativeness error associated with local geographical characteristics (e.g. surface roughness or coastal effects). As a result, GMOS attributes higher weights to the most representative grid-points and it better represents the meteorological phenomena onsite (see Figure).


Joël Bédard

Near-surface wind observations from ~5000 SYNOP (surface synoptic observations) stations were assimilated along with the operational assimilation dataset in Environment Canada global deterministic prediction system. Although results are encouraging, they are not statistically significant as a large quantity of observations are already assimilated in the system (14 million observations per day). With the objective of making a better use of near-surface wind observations and improving their impact on short-term tropospheric forecasts, this collaborative project aims at assimilating near-surface wind observations over land in the RAP system. To address the statistical significance issue, near-surface wind observations from all available surface stations located over the North American continent are considered (~20 000 SYNOP, Metar and Mesonet stations).

As of now, the GMOS operator was implemented in the GSI code and the operators statistical coefficients were obtained using historical data. The evaluation runs are currently ongoing.


Figure: Comparison of the Numerical Weather Prediction model representation of the surface roughness and topographic height with the multipoint linear regression weights at the North Cape site: (a) subset of the GEM-LAM (2.5km) horizontal grid superimposed on the site map; (b) multipoint linear regression weights; (c) modelled surface roughness; (d) modelled topographic height. Figure from Bédard et al., 2013.

Object-based Verification Methods

Visitors: Jason Otkin, Chris Rozoff, and Sarah Griffin

Autumn 2016

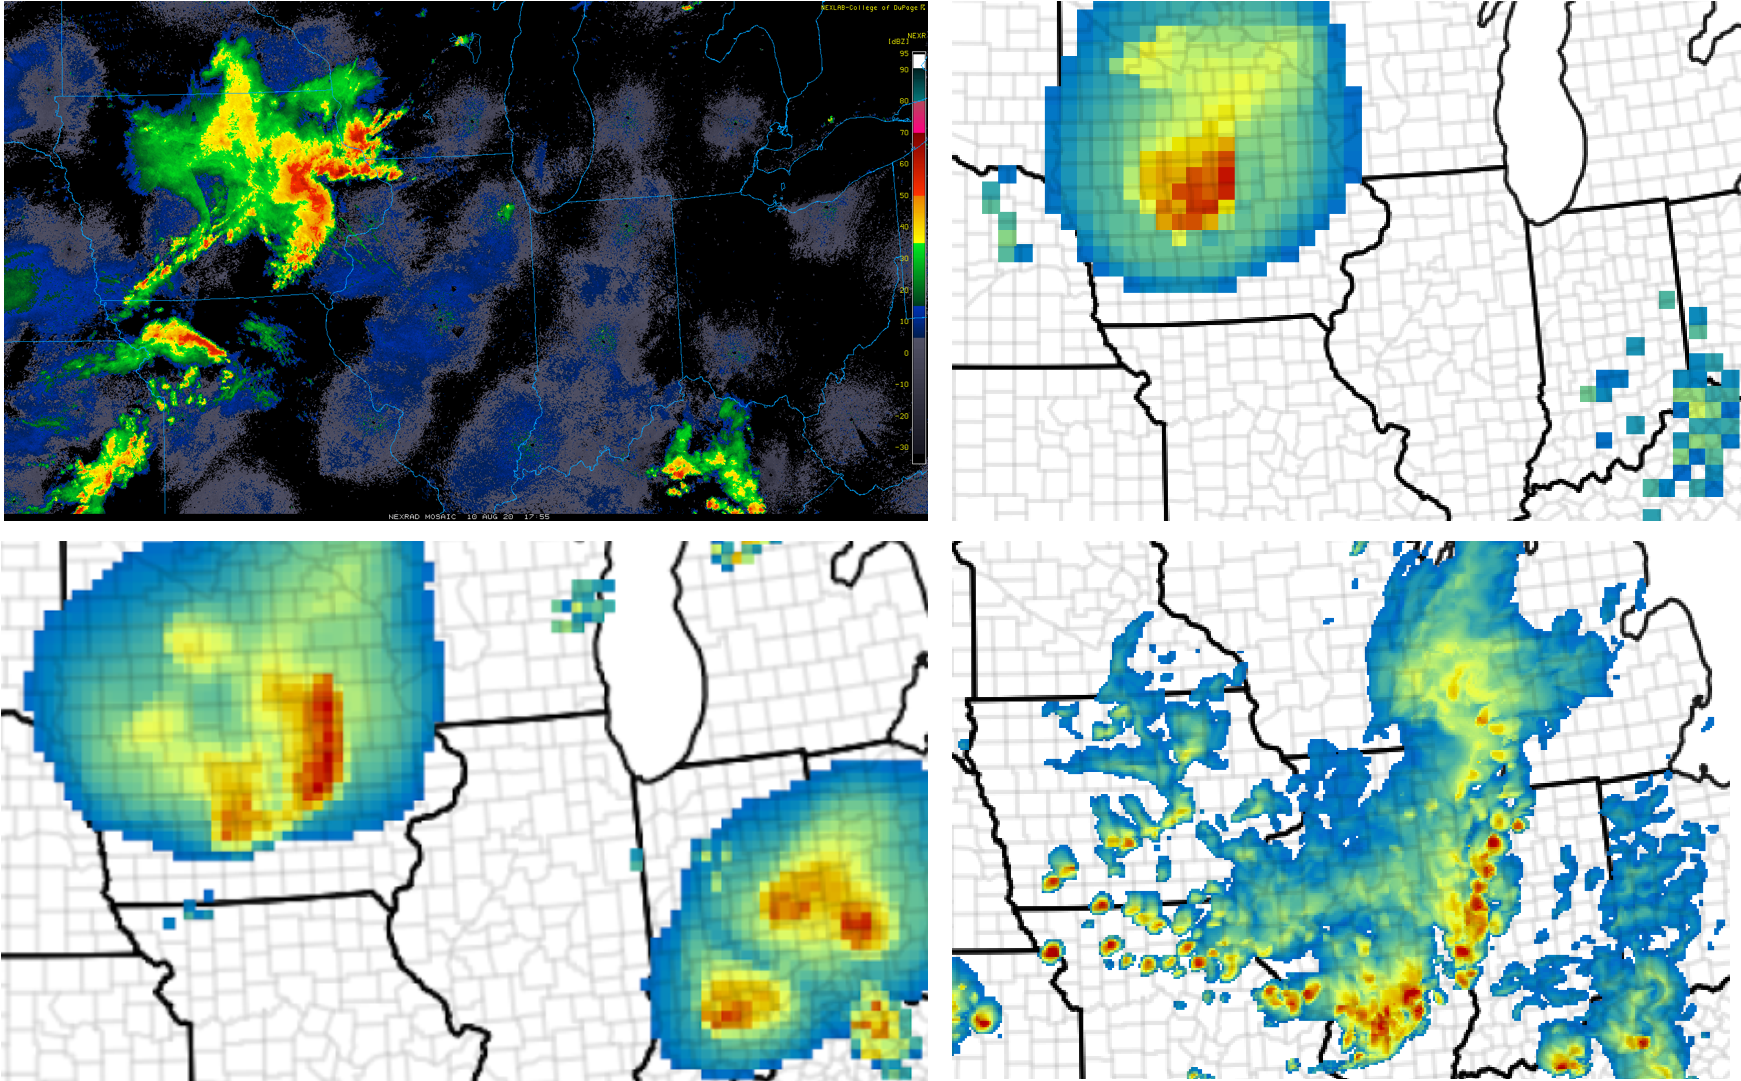
As visitors to the DTC in 2015, Jason Otkin, Chris Rozoff, and Sarah Griffin explored using object-based verification methods to assess the accuracy of cloud forecasts from the experimental High Resolution Rapid Refresh (HRRR) model. Though the forecast accuracy could be assessed using traditional statistics such as root mean square error or bias, additional information about errors in the spatial distribution of the cloud field could be obtained by using more sophisticated object-based verification methods.

The primary objective of their visit to the DTC was to learn to use the Meteorological Evaluation Tools’ Method for Object-Based Diagnostic Evaluation (MODE). Once they learned how MODE defines single objects and clusters of objects, they could use MODE output of individual objects and matched pairs to assess the forecast accuracy.

The team also wanted to develop innovative methods using MODE output to provide new insights. For example, they were able to calculate and compare how well certain characteristics of the forecast cloud object, suchs as its size and location, match those of the observed cloud object.

One outcome of their DTC visit was the development of the MODE Skill Score (MSS). The MSS uses the interest val- ues generated by MODE, which characterize how closely the forecast and observed objects match each other, along with the size of the observed object, to portray the MODE output as a single number.

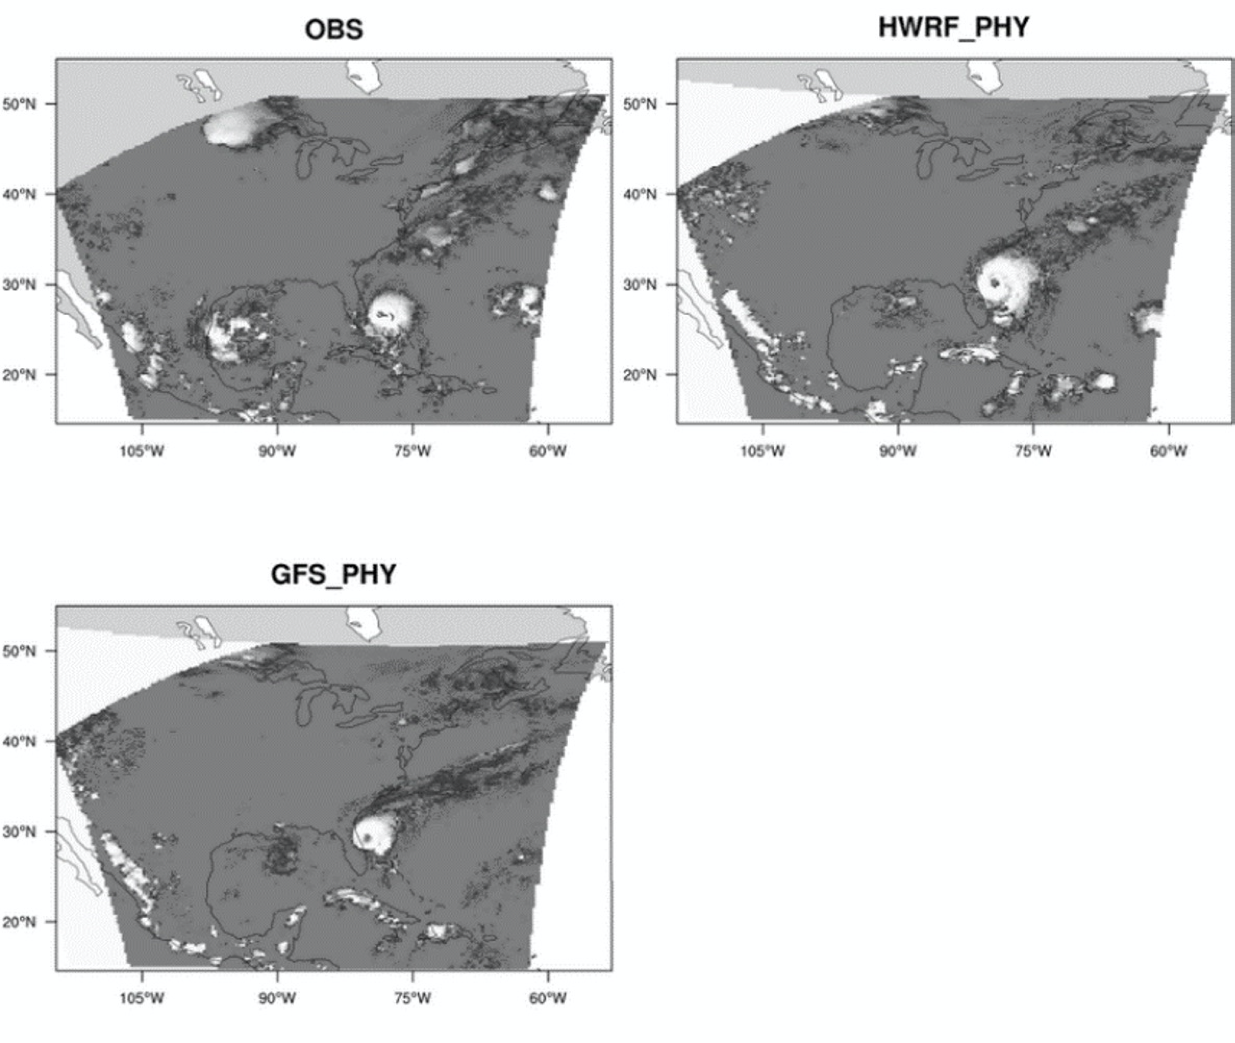
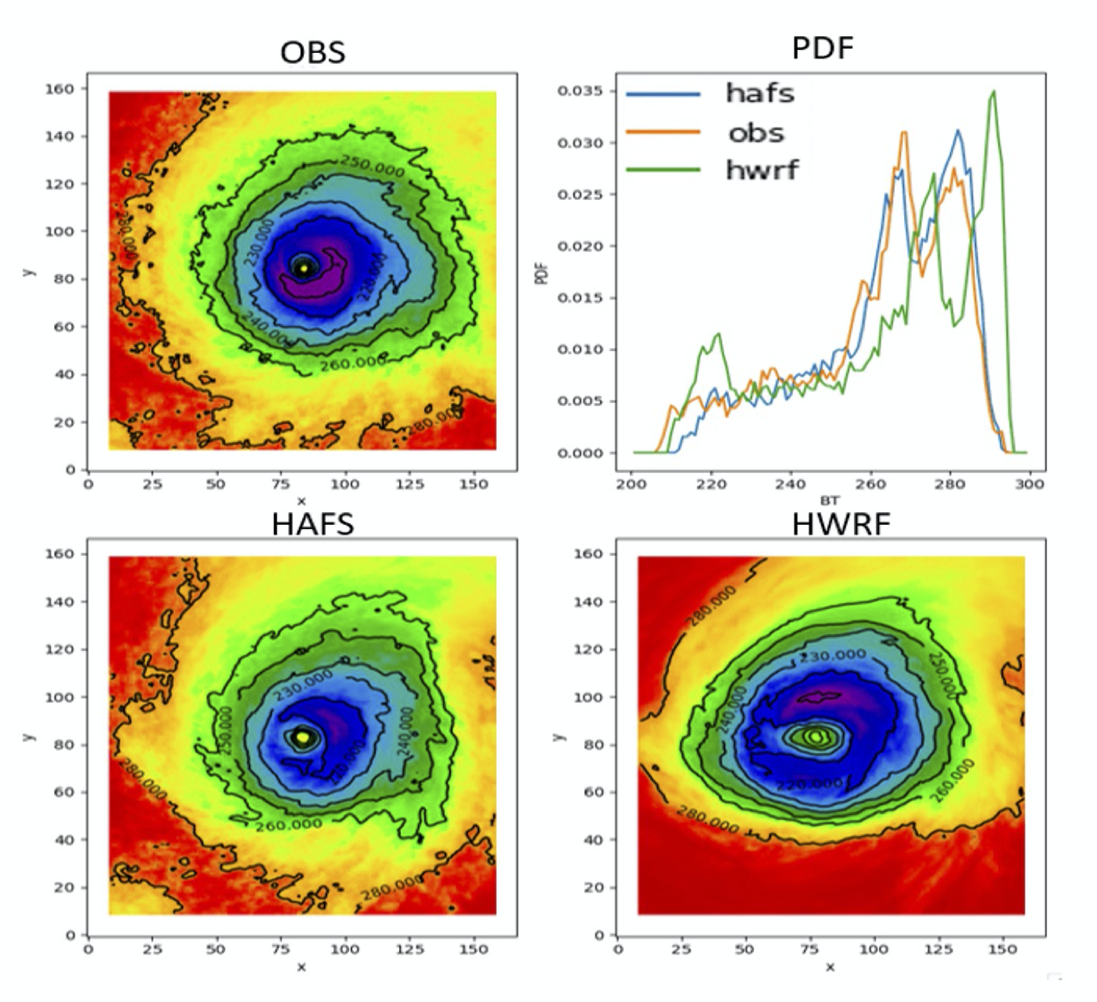
For their project, they assessed the 1-h experimental HRRR forecast accuracy of cloud objects occurring in the upper troposphere, where satellite infrared brightness temperatures are most sensitive. They used simulated Geostation- ary Operational Environmental Satellite (GOES) 10.7μm brightness temperatures generated for each HRRR forecast cycle, and compared them to the corresponding GOES observations. Forecast statistics were compiled during August 2015 and January 2016 to account for potential differences in cloud characteristics between the warm and cool seasons.

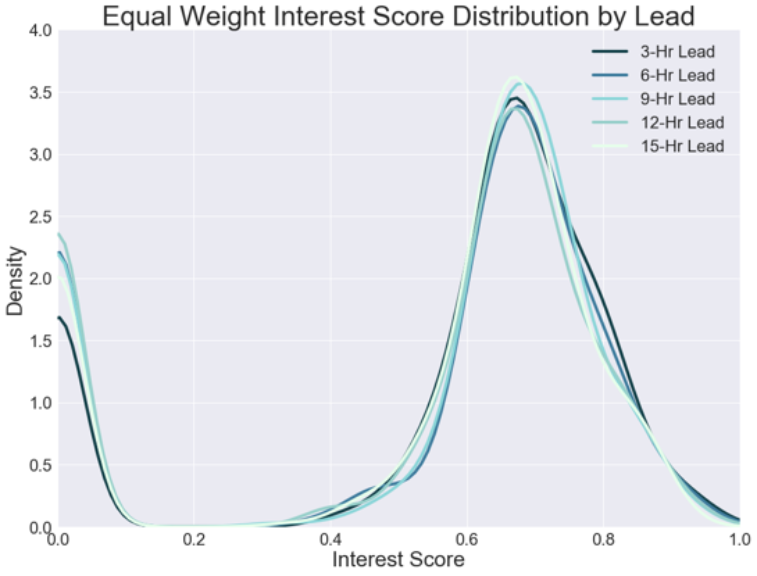
Overall, the higher interest value scores during August indicate that the sizes of the forecast objects more closely match those of the observed objects, and that the spatial displacement between their centers’ of mass is smaller. They also found smaller cloud objects have less predictability than larger objects, and that the size of the 1-h HRRR forecast cloud objects is generally more accurately predicted than their location.

The researchers hope this knowledge helps HRRR model developers identify reasons why a particular forecast hour or time period is more accurate than another. It could also help diagnose problems with the forecast cloud field to make forecasts more accurate.

Otkin, Rozoff, and Griffin were visiting from the University of Wisconsin-Madison Space Science and Engineering Center and Cooperative Institute for Meteorological Satellite Studies. They were hosted by Jamie Wolff of NCAR. The DTC visitor project allowed the team to discuss methods, insights, and results face-to-face. The team feels this project scratched the surface of how to use satellite observations and object-based verification methods to assess forecast accuracy, and that the door is open for future collaboration.

Contributed by Jason Otkin, Sarah Griffin, and Chris Rozoff.

Harnessing the Power of Evolution for Weather Prediction

Visitor: Paul Roebber

Summer 2016

As a DTC Visitor in 2015, Paul Roebber explored an idea for generating ensemble weather predictions known as evolutionary programming (EP). The method relies on a gradually and increasingly restrictive cost function to produce and to evaluate succeeding generations of a population of algorithms until such time as a best ensemble solution is determined based on cross-validation. The approach was developed by Roebber to produce baseline prediction equations equivalent to linear or nonlinear multiple regression equations (a kind of model output statistics or MOS) modified by if-then conditionals and using observations as well as numerical weather prediction (NWP) model output.

The prime objective of his DTC Visitor project was to explore possible improvements to the method. A first step, using the Yellowstone supercomputer, was to consider the relative contribution of large ensemble populations, numbering from 3,000 to as many as 500,000 possible members, to ensemble diversity. As illustrated in the figure below for 60 hour forecasts of minimum temperature, smaller as well as very large EP ensembles outperform the GFS 21-member ensemble MOS forecasts in both a deterministic (RMSE) and probabilistic (Brier Skill Score; BSS) sense, but the increase in ensemble size (indicated by the size of the bubbles) provides only minor additional skill.

Specific issues explored in the context of next-day heavy convective rainfall forecasting included: the performance of the method regionally and locally, compared to multiple logistic regression (MLR) and artificial neural networks (ANN); and ensemble member selection for use in bias calibration such as Bayesian Model Combination.

As illustrated in the performance diagram in the figure below for regional forecasts of rainfall in excess of 1.5 inches, the MLR and EP demonstrate comparable skill, and both superior to that of a trained ANN. The slightly different performance characteristics (higher hits and false alarms versus lower hits and false alarms) of the three methods suggests the possibility of combining the information in useful ways operationally. Insights gained from this work are leading to several collaborations with NOAA scientists related to adaptive systems and deep learning networks.

Diagnosing Tropical Cyclone Motion Forecast Errors in HWRF

Visitor: Thomas Galarneau

Winter 2014
Thomas Galarneau

As a DTC visitor in 2013, Thomas Galarneau has applied a new diagnostic method for quantifying the phenomena responsible for errors in tropical cyclone (TC) storm tracks to an inventory of recent hurricanes.

The method is founded on the notion that errors in storm motion at relatively short lead times (12- 48 h) lead to large position errors at later times. The objective of his DTC Visitor Project was to diagnose sources of error in TC motion forecasts from the HWRF model. Of particular interest was the impact of model errors in forecasts of the environmental steering flow at different stages of Atlantic Basin TC evolution. By isolating the vortex structure from the larger-scale flow in a TC-relative framework, he has been able to show (as in the scatterplot in the figure below) that during the northeastward-moving (post-curvature) phase, TC motion errors are generally southwestward. As illustrated in the TC-relative geographical plot of the figure below, this error can be attributed to a northeasterly environment wind error larger than 1.0 m/s, which in turn appears to be associated with an anticyclonic error to the northwest, and a cyclonic error to the southeast, of the forecasted TC. Further details of his project will be available soon at http://www.dtcenter. org/visitors/year_archive/ 2013/ when DTC visitor reports are posted.


HWRF TC forecast graphic

HWRF 850-500 graphic

Cold Pools and the WRF

Visitors: Robert Fovell and Travis Wilson

Summer 2013

Robert Fovell and Travis Wilson from the University of California/Los Angeles recently completed a visitor project titled “Improvements to modeling persistent surface cold pools in WRF”, aspects of which will be part of Travis’ PhD work. Travis spent nine months working at the DTC in Boulder, much of the time with his DTC host Jamie Wolff, and Rob visited for two weeks in March and June. A principal motivation for their study was the occasionally poor prediction in numerical models (including in WRF) of the formation and breakup of fog in the Central Valley in California and the possibility that better land surface models would improve those predictions. One significant result of their study is the development of a hybrid land surface model that convolves the complexity of the Noah land surface model’s soil moisture formulation with the simplicity of a thermal diffusion (slab) heat transfer model. Some of their results were presented at the recent WRF Users Workshop in Boulder and can be linked to at http://www.mmm.ucar.edu/wrf/users/ workshops/WS2013/ppts/4.4.pdf


Wave graphic

Towards a better understanding of the vertical aerosol distribution in the atmosphere

Visitor: Barbara Scherllin-Pirscher

Winter

On 14 April 2010, increasing volcanic activity, including explosive eruptions, were observed at the Icelandic volcano Eyjafjallajökull. The volcano was largely unknown by the general public until then. On that particular day, however, the volcano started ejecting fine ash into the atmosphere, which was advected towards continental Europe. Major disruptions of the air traffic across western and northern Europe were necessary in order to ensure aviation safety. Several countries closed their airspace, affecting approximately 10 million travelers all over the world and causing an enormous economic loss.


Barbara Scherllin-Pirscher, DTC Visitor

The widespread disruption of the air traffic could have been strategically localized and reduced had the horizontal and vertical dispersion of the ash plume been predicted with higher accuracy. At present, there is limited information regarding the vertical distribution of aerosols since aerosol observations are mainly surface-based in-situ measurements or vertically integrated measurements such as Aerosol Optical Depth (AOD). Ground-based LIght Detection And Ranging (LIDAR) measurements and LIDAR measurements from satellites can be used to close this gap. The aim of my DTC visiting scientist project is to implement the assimilation of vertically-resolved LIDAR measurements in the Gridpoint Statistical Interpolation (GSI) data assimilation system. This addition is expected to lead to improved knowledge of the vertical distribution of aerosols in the atmosphere and improved model forecasts.


Figure 1. Global maps of AOD at 550 nm from CRTM (top) and AOD difference between CRTM and MERRA (bottom) on 17 April 2010. Positive differences correspond to CRTM AOD values larger than those for MERRA.

The backbone of high-quality aerosol data assimilation is a good radiative transfer model. We have implemented the simulation of aerosol extinction and backscattering coefficients into the Community Radiative Transfer Model (CRTM), which is embedded in the GSI and tested its performance. Global fields of Modern Era Retrospective-analysis for Research and Applications (MERRA) aerosol concentrations were used as input to calculate Aerosol Optical Properties (AOP). Figure 1 (top) shows AOD at 550 nm on 17 April 2010. Highest aerosol loads were found above the Saharan region in North Africa as well as in East Asia. High AOD in the northwestern part of Russia was caused by aerosols from the Eyjafjallajökull eruption. Comparing CRTM and MERRA (Fig. 1 bottom) reveals higher AOD in the CRTM over the oceans but lower values over continental regions with high dust load.


Figure 2. Vertically-resolved CALIPSO measurements of the backscattering coefficient at 532 nm from an overpass over North Africa (top) ​​​and the North Atlantic (bottom) on 17 April 2010.

To investigate these features, we selected a set of vertically-resolved LIDAR measurements from the Cloud-Aerosol Lidar and Infrared Pathfinder Satellite (CALIPSO) satellite obtained over North Africa and the North Atlantic (Fig. 2). The comparison between the models and the observations (Fig. 3) reveals a better performance of MERRA AOP over the dusty region in North Africa but a slightly better performance of CRTM over the ocean. Preliminary results suggest CRTM deficiencies in modeling the non-spherical shape of dust aerosols but a better parameterization of the hygroscopic growth of sea salt. These features, however, need to be investigated in more detail.


Figure 3. Vertical profiles of the backscattering coefficient difference of CALIPSO and MERRA (median difference in red, mean difference in yellow) as well as of CALIPSO and CRTM (median difference in blue, mean difference in green) over North Africa (top) and the North Atlantic (bottom).

My visit at NOAA and NCAR is coming to an end but the project is not finished yet and I will continue my work from Austria. I’m very grateful to Benjamin Johnson (UCAR/JCSDA) and Mariusz Pagowski (NOAA/ESRL/GSD and CIRES/CU Boulder) who cordially hosted me during my DTC visiting scientist project, shared their knowledge and supported me whenever necessary. This project would not have been possible without the financial support of the DTC Visiting Scientist Program and the Horizon2020 project EUNADICS-AV (No. 723986).

Contributed by Barbara Scherllin-Pirscher.