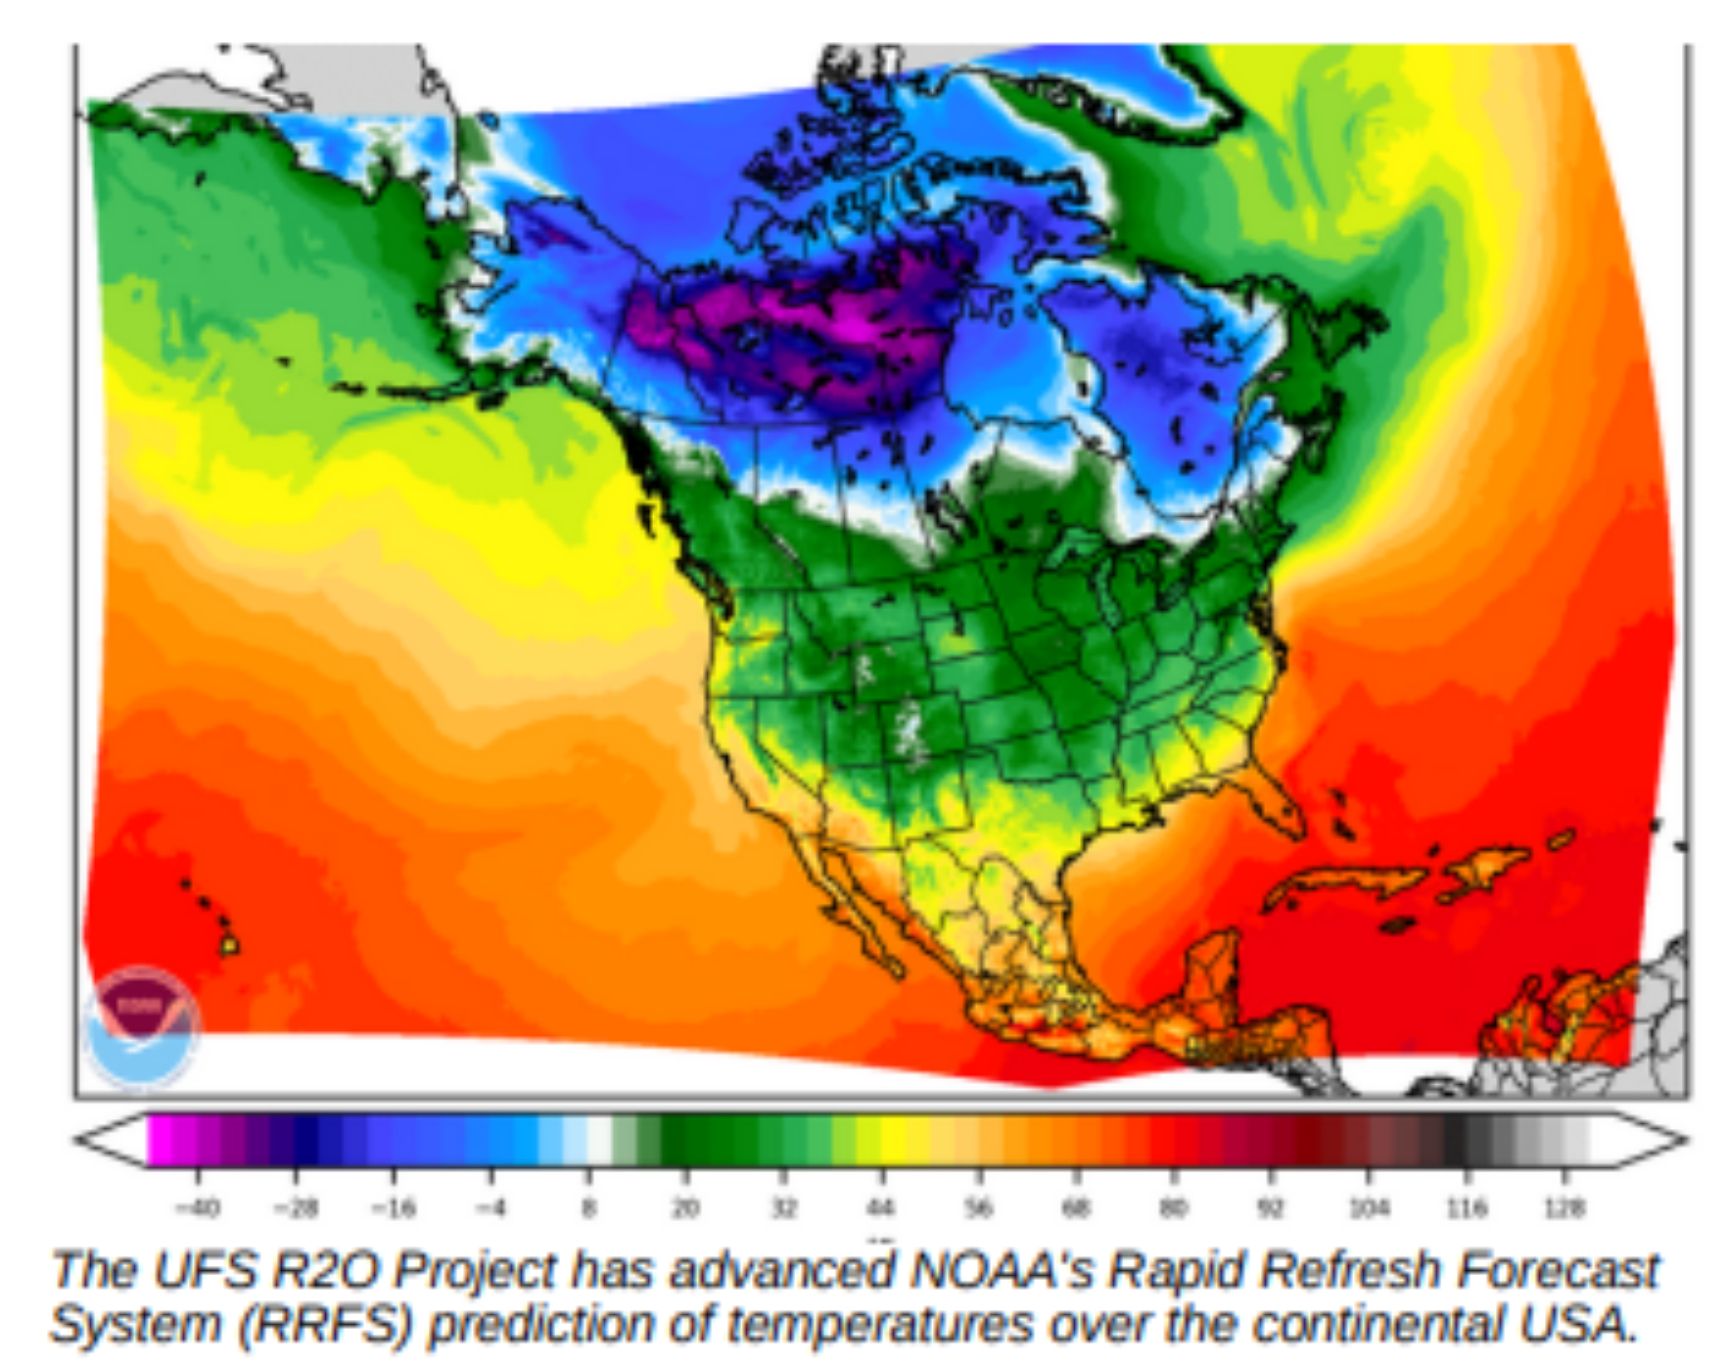
The DTC has been tasked by the US Air Force to investigate new approaches to evaluate cloud forecast predictions. Accurate cloud forecasts are critical to the Air Force national intelligence mission because clouds can mask key targets, obscure sensors, and are a hazard to Remotely Piloted Aircraft. This work that will help forecast users and developers understand their characteristics of these predictions, and suggest ways to make the predictionsm more accurate.
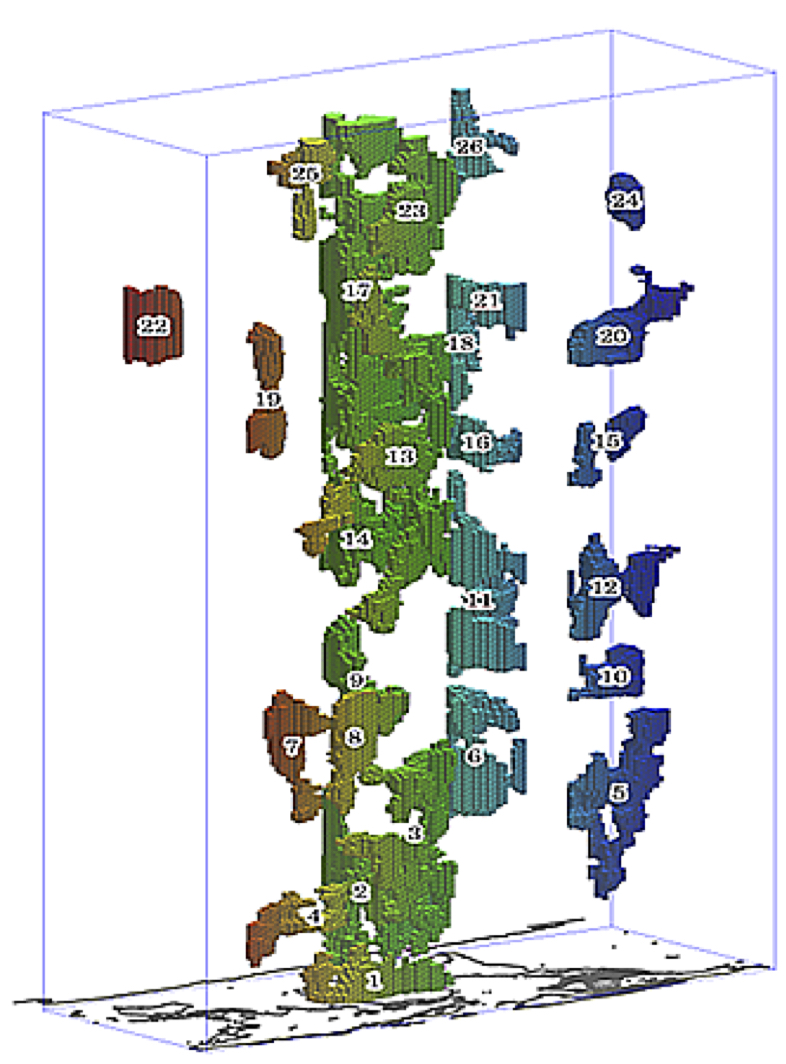
Clouds have significant impacts on many kinds of decisions. Among other applications, accurate cloud forecasts are critical to the national intelligence mission. Clouds can mask key targets, obscure sensors, and are a hazard to Remotely Piloted Aircraft. The locations of clouds, as well as other cloud characteristics (e.g., bases, tops), are difficult to predict because clouds are 3three-dimensional and they form and dissipate quickly at multiple levels in the atmosphere. In addition, cloud predictions integrate across multiple components of numerical weather prediction systems. Evaluation of cloud predictions is not straightforward for many of the same reasons.
The DTC has been tasked by the US Air Force to investigate new approaches to evaluate cloud forecast predictions that will help forecast users and developers understand their characteristics and suggest ways to make the predictions more accurate.
The DTC effort, in collaboration with staff at the Air Force’s 557th Weather Wing, focuses on testing a variety of verification approaches. , including tTraditional verification methods for continuous and categorical forecasts provide a baseline evaluation of quality (e.g., Mean Error, Mean Absolute Error, Gilbert Skill Score, Probability of Detection). that provide a baseline evaluation of quality, sSpatial methods (e.g., the Method for Object-based Diagnostic Evaluation [MODE]) and field deformation approaches that provide greater diagnostic information about cloud prediction capabilities., Nand new distance metrics that characterize the distances between forecast and observed cloud features. This evaluation will help identify new tools, including a cloud-centric NWP index, to consider for implementation and operational application in the Model Evaluation Tools (MET) verification software suite.
For the evaluation, the team is focusing initially on forecast and observed total cloud amount (TCA) fractional cloud coverage datasets for six cloud products for one week-periods for each of four seasons, for six cloud products:
- WorldWide Merged Cloud Analysis (WWMCA) developed by the Air Force;
- A WWMCA reanalysis (WWMCAR) product that includes latent observations not included in the real-time version of WWMCA;
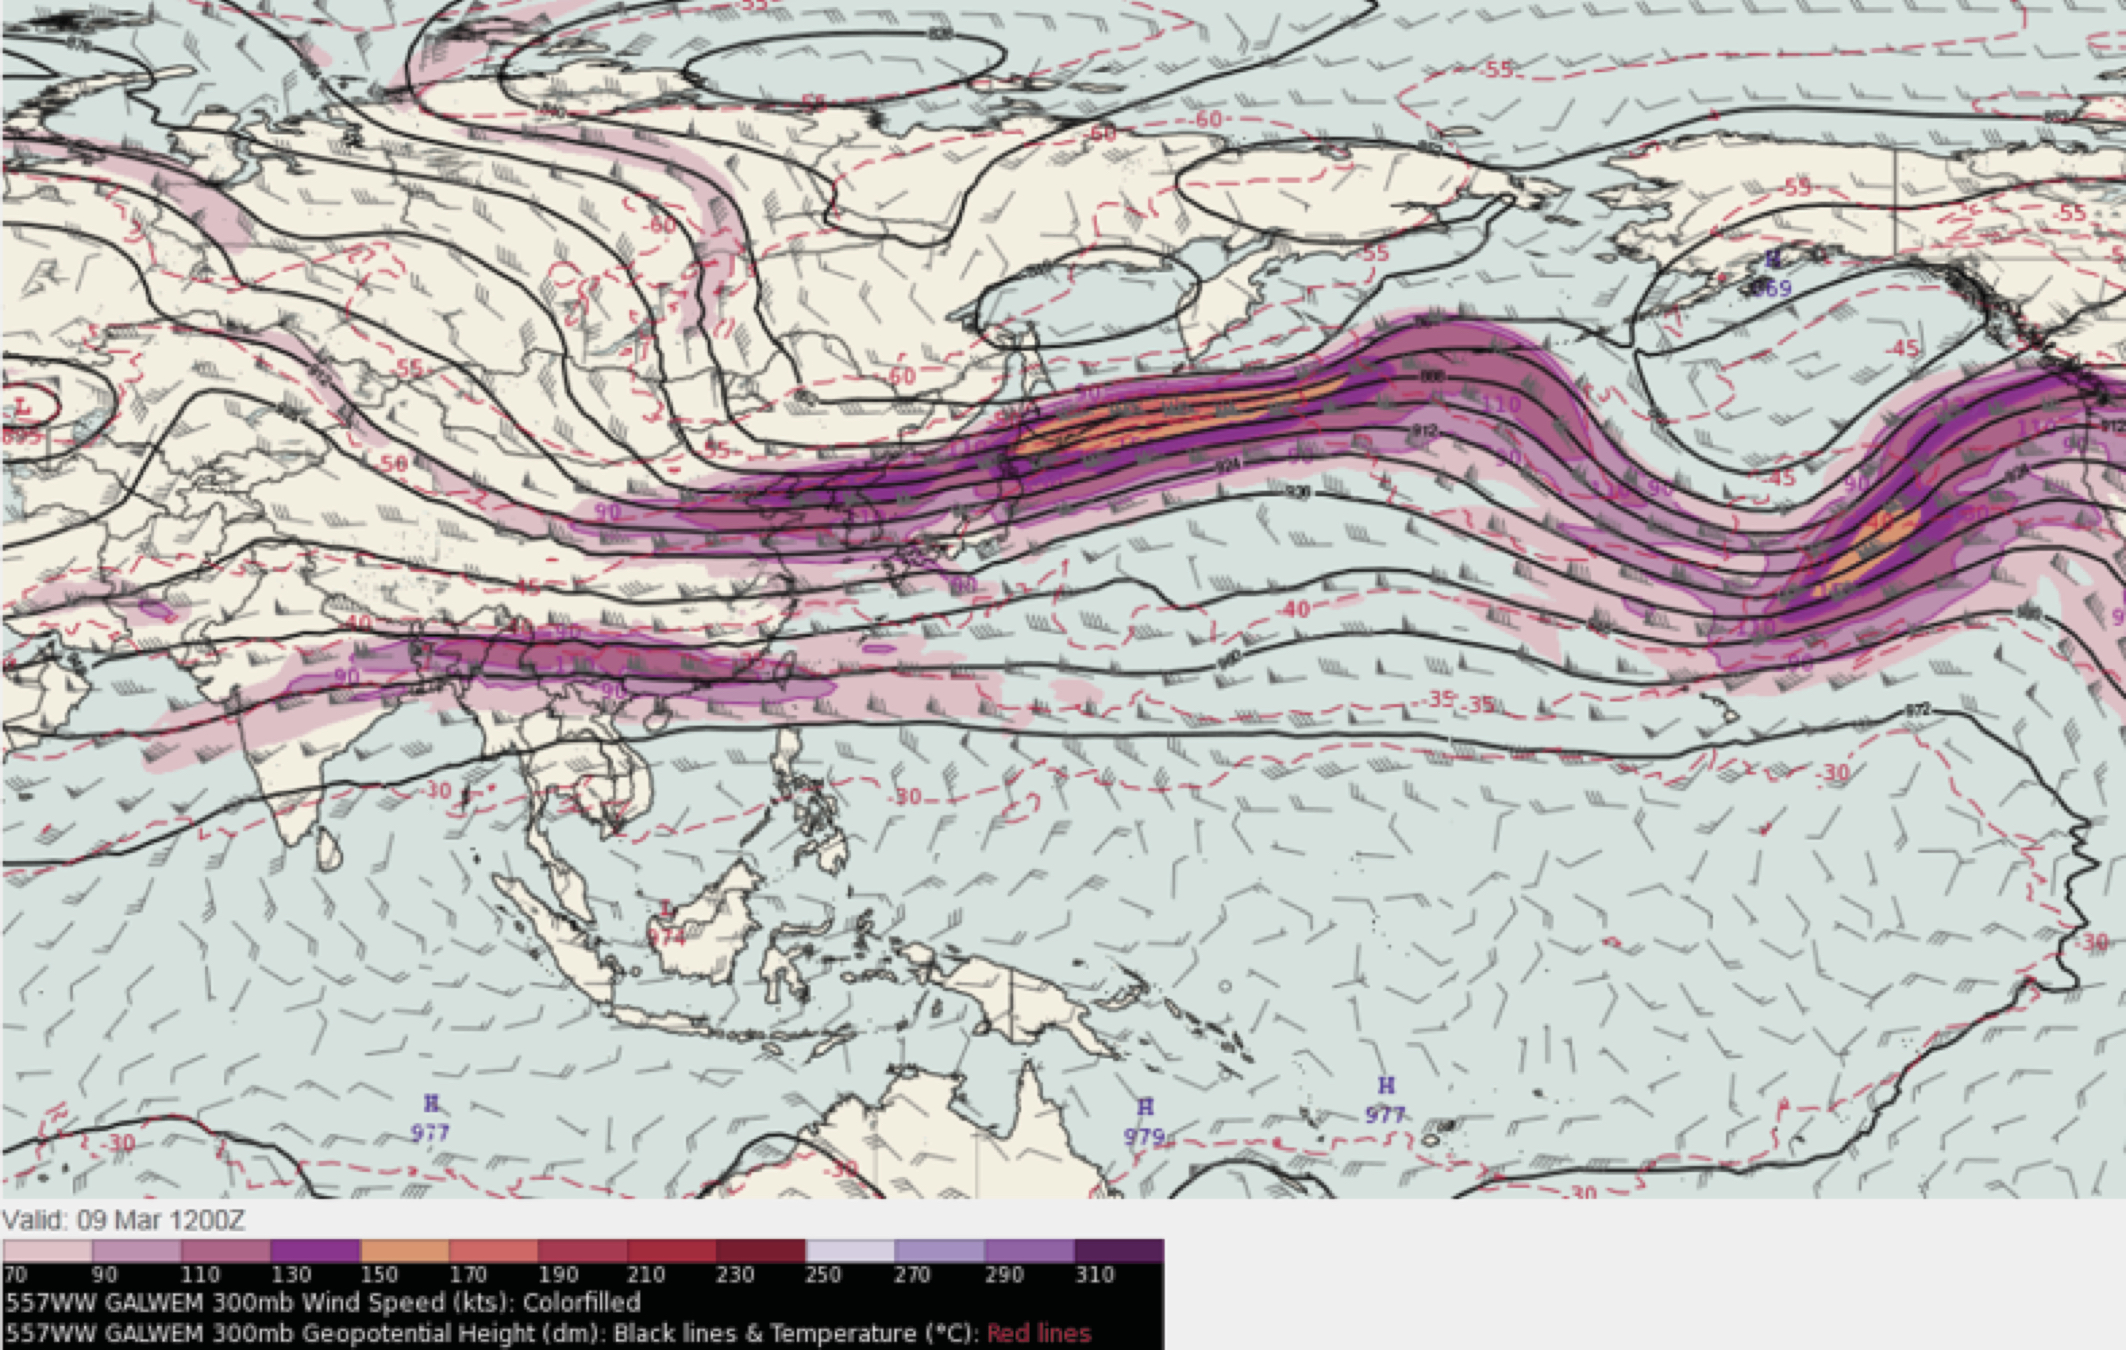
- Forecasts (out to 72 h) of TCA from the USAF Global Air Land Weather Exploitation Model (GALWEM) which is the Air Force implementation of the United Kingdom’s Unified Model;
- TCA forecasts (out to 72 h) from the NCEP Global Forecast System (GFS) model;
- Biascorrected versions of the GALWEM and GFS predictions (GALWEM-DCF and GFS-DCF); and
- Shortterm TCA predictions (out to 9 h) from the Advective cloud model (ADVCLD).
Datasets used in the evaluation were from one week-periods for each of four seasons.
Methods and results
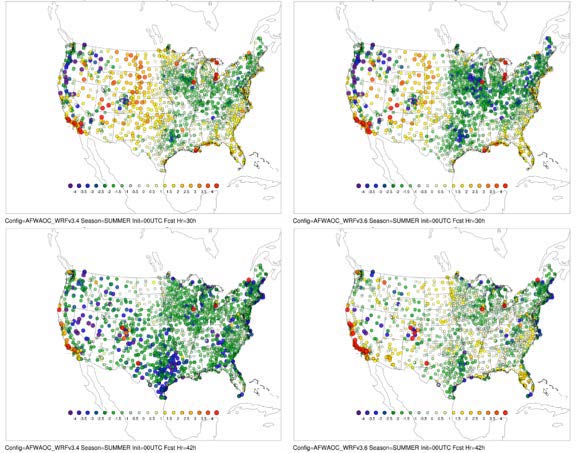
Results of the application of the various verification methods indicated that continuous approaches are not very meaningful for evaluating cloud predictions, particularly because due to they are discontinuous in nature of clouds. In contrast, categorical approaches can provide information that is potentially quite useful, particularly when applied to thresholds that are relevant for AF decision-making (e.g., overcast, clear conditions), and when the results are presented using a multivariate approach such as the performance diagrams first applied by Roebber (WAF, 2009). The MODE spatial method also shows great promise for diagnosing errors in cloud predictions (e.g., size biases, displacements). However, more effort is required to identify optimal configurations of the MODE tool for application to clouds for AF decision making.
Initial testing of field deformation methods indicated that these approaches have a good are potentially of being useful for evaluation of cloud forecasts. Field deformation methods evaluate how much a forecast would have to change in order to best match the observed field. Information about the amount and type of deformation required can be estimated, along with the resulting reduction in error.
The results also indicated that, in general, cloud amount forecasts lend themselves to verification through binary image metrics because a cloud’s presence or absence can be ascertained through categories of cloud amount thresholds. These metrics can provide very succinct information about many aspects of forecast performance in this context without having to resort to complicated, computationally expensive techniques. For example, Baddley’s ∆ metric gives an overall useful summary of how well two cloud-amount products compare in terms of size, shape, orientation and location of clouds., and tThe Mean Error Distance (MED) gives meaningful information about misses and false alarms, but is sensitive to small changes in the field. In addition to the distance metrics, a geometric index that measures three geometric characteristics (area, connectivity, and shape ) could potentially provide additional useful information, especially when the cloud field is not too complex (i.e., is comprised of a small number of features).
Ongoing and future efforts
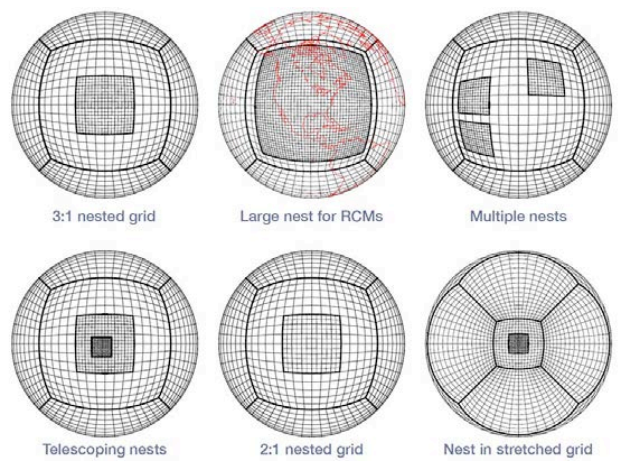
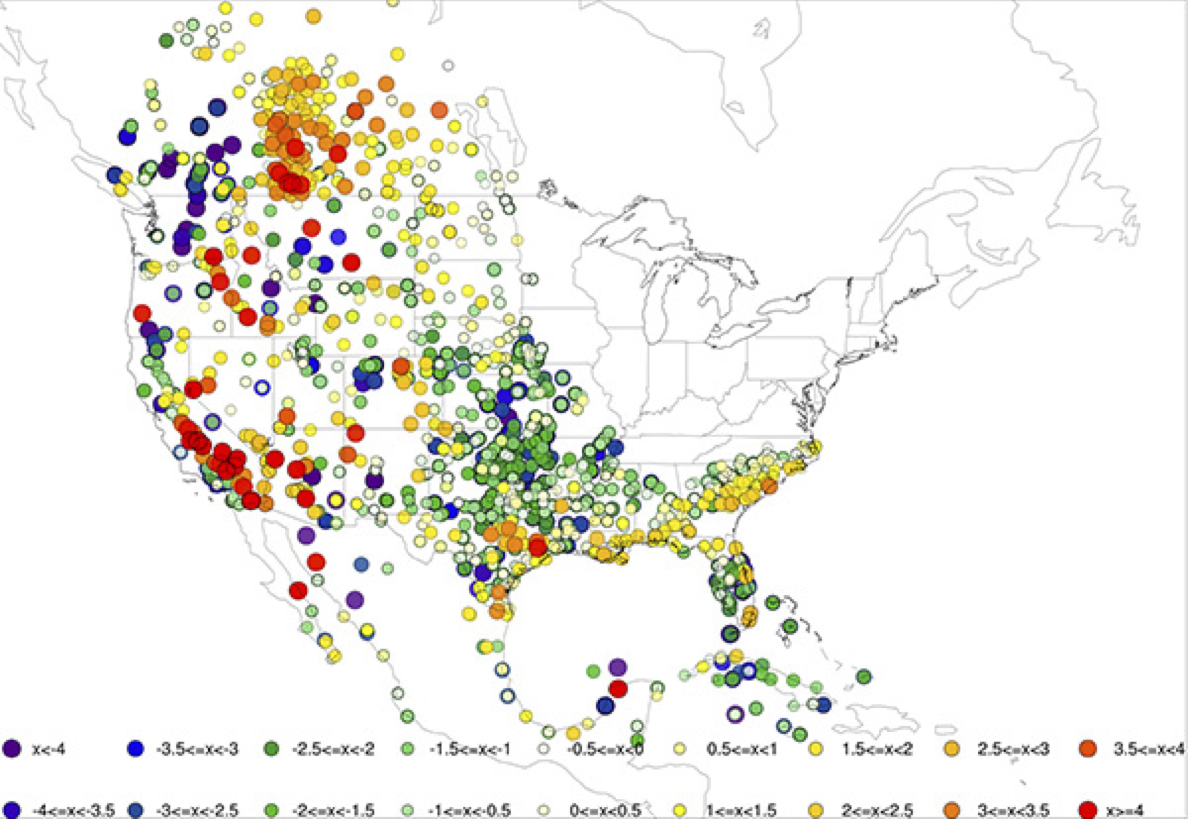
Ongoing efforts on this project are focused on extending the methods to global cloud amounts (the initial work focused on North America), and further refinements and tests of the methods. For example, MODE configurations are being identified in collaboration with the AF 557th Weather Squadron, to ensure the configurations are relevant for AF decision-making. In addition, canonical evaluations (i.e., with “artificial” but realistic cloud distributions) of the distance metrics [1] are being examined to determine if any unknown biases or poor behavior exist that would influence the application of these methods. As these extensions are completed, a set of tools will be identified that provide meaningful – and complete – information about performance of TCA forecasts. Further efforts will focus on other cloud parameters such as cloud bases and tops.
The canonical evaluations only apply to the distance metrics, not all of the methods.