Binary Categorical Forecasts
The first group of verification types to consider is one of the more basic, but most often used. Binary categorical forecast verification seeks to answer the question “did the event happen”. Some variables (e.g., rain/no rain) are by definition binary categorical, but every type of meteorological variable can be evaluated in the context of a binary forecast (e.g., by applying a threshold): Will the temperature exceed 86 degrees Fahrenheit? Will wind speeds exceed 15 knots? These are just some examples where the observations fall into one of only two categories, yes or no, which are created by the two categories of the forecast (e.g. the temperature will exceed 86 degrees Fahrenheit, or it will stay at or below 86 degrees Fahrenheit).
Imagine a simplified scenario where the forecast calls for rain.
A hit occurs when a forecast predicts a rain event and the observation shows that the event occurred. In the scenario, a hit would be counted if rain was observed. A false alarm would be counted when the forecast predicted an event, but the event did not occur (i.e., in the scenario, this would mean no rain was observed). As you may have figured out, there are two other possible scenarios to cover for when the forecast says an event will not occur.
To describe these, imagine a second scenario where the forecast says there will be no rain.
Misses count the occasions when the forecast does not predict the event to occur, but it is observed. In this new scenario, a miss would be counted if rain was observed. Finally, correct rejections are those times that a forecast says the event will not occur, and observations show this to be true. Thus, in the rainfall scenario a correct rejection would be counted if no rain was forecasted and no rain was observed.
Because forecast verification is rarely performed on one event, a contingency table can be utilized to quickly convey the results of multiple events that all used the same binary event conditions. An example contingency table is shown here:
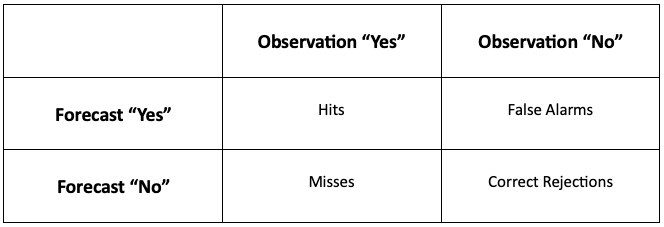
Each of the paired categorical forecasts and observations can be assigned to one of the four categories of the contingency table. The statistics that are used to describe the categorical forecasts’ scalar attributes (accuracy, bias, reliability, etc.) are computed using the total counts in these categories.
It is important not to forget the total number of occurrences and non-occurrences, n, that are contained in all four categories. If n is too small, it can be easy to arrive at a misleading conclusion. For example, if a forecaster claims 100% accuracy in their rain forecast and produces a contingency table where the forecast values were all hits but n=4, the conclusion is technically correct, but not very scientifically sound!