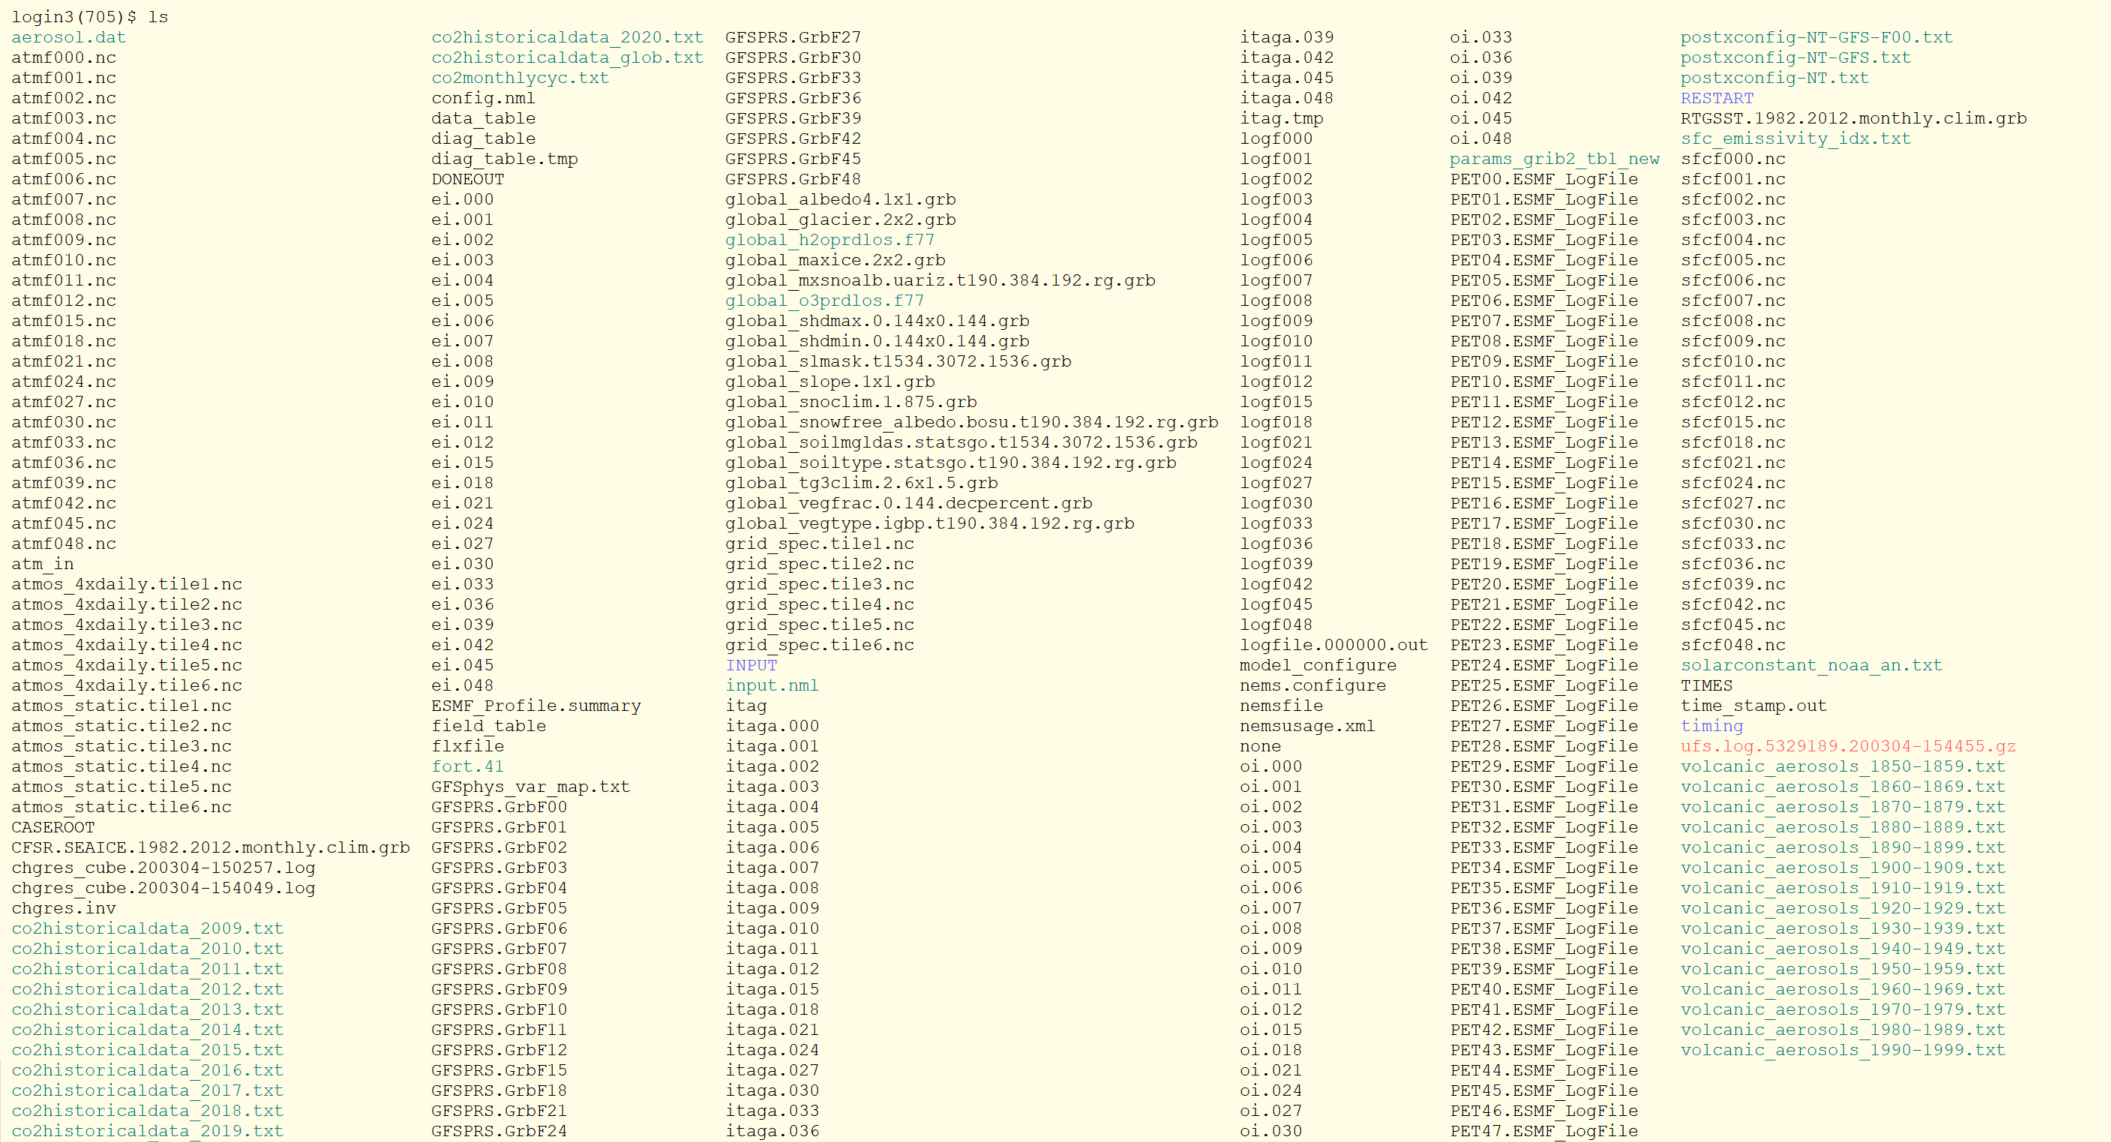
Your outputs will be in the $UFS_SCRATCH/ufs-mrweather-app-workflow.c96/run directory. After a successful run, the directory will look like this:

For visually checking the results of your run, we have provided a NCL script that plots 2-m temperature (tmp2m) and total precipitation (tprcp) at 48 h.
You will need to load NCL first:
Then get and run the script:
wget https://raw.githubusercontent.com/wiki/ufs-community/ufs-mrweather-app/files/plot_ufs_sfcf.ncl
ncl plot_ufs_sfcf.ncl
To visualize the resulting images in png, use the command:
display plot_ufs_phyf_tprcp.png
The sample plots are below.
Now that you completed this step, the next step is to change a namelist option and run a second test to check your understanding of how results will change.

