The SeriesAnalysis use case utilizes the MET Series-Analysis tool.
Optional: Refer to the MET Users Guide for a description of the MET tools used in this use case.
Optional: Refer to the METplus Config Glossary section of the METplus Users Guide for a reference to METplus variables used in this use case.
-
Review the use case configuration file: SeriesAnalysis.conf
This use-case shows a simple example of running Series-Analysis across precipitation forecast fields at 3 different lead times. Forecast data is from WRF output, while observational data is Stage II quantitative precipitation estimates.
Note: Forecast and observation variables are referred to individually including reference to both the NAMES and LEVELS, which relate to .
FCST_VAR1_NAME = APCP
FCST_VAR1_LEVELS = A03
OBS_VAR1_NAME = APCP_03
OBS_VAR1_LEVELS = "(*,*)"
Which relates to the following fields in the MET configuration file
field = [
{
name = "APCP";
level = [ "A03" ];
}
];
}
obs = {
field = [
{
name = "APCP_03";
level = [ "(*,*)" ];
}
];
}
Also note: Paths in SeriesAnalysis.conf may reference other config options defined in a different configuration files. For example:
where INPUT_BASE which is set in the tutorial.conf configuration file. METplus config variables can reference other config variables even if they are defined in a config file that is read afterwards.
-
Run the use case:
${METPLUS_BUILD_BASE}/parm/use_cases/met_tool_wrapper/SeriesAnalysis/SeriesAnalysis.conf \
${METPLUS_TUTORIAL_DIR}/tutorial.conf \
config.OUTPUT_BASE=${METPLUS_TUTORIAL_DIR}/output/SeriesAnalysis
METplus is finished running when control returns to your terminal console and you see the following text:
-
Review the output files:
You should have output file in the following directories:
2005080700_sa.nc
netcdf \2005080700_sa {
dimensions:
lat = 129 ;
lon = 185 ;
variables:
float lat(lat, lon) ;
lat:long_name = "latitude" ;
lat:units = "degrees_north" ;
lat:standard_name = "latitude" ;
float lon(lat, lon) ;
lon:long_name = "longitude" ;
lon:units = "degrees_east" ;
lon:standard_name = "longitude" ;
int n_series ;
n_series:long_name = "length of series" ;
float series_cnt_TOTAL(lat, lon) ;
series_cnt_TOTAL:_FillValue = -9999.f ;
series_cnt_TOTAL:name = "TOTAL" ;
series_cnt_TOTAL:long_name = "Total number of matched pairs" ;
series_cnt_TOTAL:fcst_thresh = "NA" ;
series_cnt_TOTAL:obs_thresh = "NA" ;
float series_cnt_RMSE(lat, lon) ;
series_cnt_RMSE:_FillValue = -9999.f ;
series_cnt_RMSE:name = "RMSE" ;
series_cnt_RMSE:long_name = "Root mean squared error" ;
series_cnt_RMSE:fcst_thresh = "NA" ;
series_cnt_RMSE:obs_thresh = "NA" ;
float series_cnt_FBAR(lat, lon) ;
series_cnt_FBAR:_FillValue = -9999.f ;
series_cnt_FBAR:name = "FBAR" ;
series_cnt_FBAR:long_name = "Forecast mean" ;
series_cnt_FBAR:fcst_thresh = "NA" ;
series_cnt_FBAR:obs_thresh = "NA" ;
float series_cnt_OBAR(lat, lon) ;
series_cnt_OBAR:_FillValue = -9999.f ;
series_cnt_OBAR:name = "OBAR" ;
series_cnt_OBAR:long_name = "Observation mean" ;
series_cnt_OBAR:fcst_thresh = "NA" ;
series_cnt_OBAR:obs_thresh = "NA" ;
From this output, we can see CNT line type statistics: TOTAL, RMSE, FBAR, and OBAR. These correspond to what we requested from the configuration file for output:
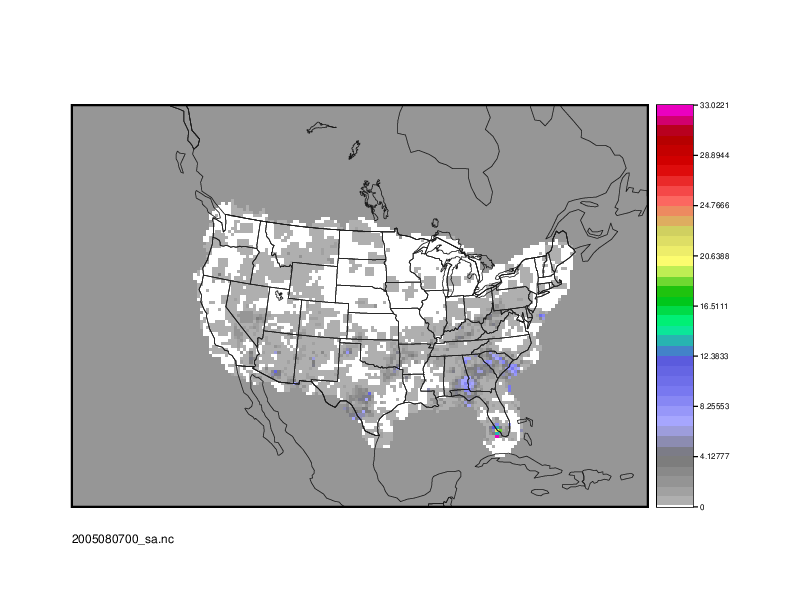
From the GUI that pops up, select the series_cnt_RMSE variable to view it. The image that displays is the RMSE value calculated at each grid point across the three lead times selected in the METplus configuration file.
There are two more files located in the output directory that while not statistically useful, do contain information on how METplus ran the SeriesAnalysis configuration file.
FCST_FILES contains all of the files that were found fitting the input templates for the forecast files. These are controlled by FCST_SERIES_ANALYSIS_INPUT_DIR and FCST_SERIES_ANALYSIS_INPUT_TEMPLATE. In our configuration file, these are set to
FCST_SERIES_ANALYSIS_INPUT_TEMPLATE = {init?fmt=%Y%m%d%H}/wrfprs_ruc13_{lead?fmt=%2H}.tm00_G212
Because {INPUT_BASE} is not changing for this run and the use case uses one initialization time, the lead sequences, set with the LEAD_SEQ variable and substituted in for {lead?fmt=%2H} in FCST_SERIES_ANALYSIS_INPUT_TEMPLATE, are what causes multiple files to be found. Specifically, FCST_FILES has three listed files, matching the LEAD_SEQ list from the configuration file.
Likewise, OBS_FILES contains all of the files that were found fitting the input templates for the observation files. These were controlled by OBS_SERIES_ANALYSIS_INPUT_DIR and OBS_SERIES_ANALYSIS_INPUT_TEMPLATE found in the configuration file.
-
Review the log output:
Log files for this run are found in ${METPLUS_TUTORIAL_DIR}/output/SeriesAnalysis/logs. The filename contains a timestamp of the current day.
Inside the log file all of the configuration options are listed, as well as the command that was used to call Series-Analysis:
Note that FCST_FILES and OBS_FILES were passed at runtime, rather than individual files.
There's also room for improvement noted in the low level verbosity comments of the log file:
WARNING:
WARNING: A block size of 1024 for a 185 x 129 grid requires 24 passes through the data which will be slow.
WARNING: Consider increasing "block_size" in the configuration file based on available memory.
WARNING:
This is a result of not setting the SERIES_ANALYSIS_BLOCK_SIZE in the METplus configuration file, which then defaults to the MET_INSTALL_DIR/share/met/config/SeriesAnalysisConfig_default value of 1024.
-
Create imagery for a variable in the netCDF output
While ncview was used to review the statistical imagery created by SeriesAnalysis, there is always the option to create an image using the Plot-Data-Plane tool. These images can be easily shared with others and used to demonstrate output in a presentation.
Use the following command to generate an image of the RMSE:
${METPLUS_TUTORIAL_DIR}/output/SeriesAnalysis/met_tool_wrapper/SeriesAnalysis/2005080700_sa.nc \
${METPLUS_TUTORIAL_DIR}/output/SeriesAnalysis/met_tool_wrapper/SeriesAnalysis/2005080700_RMSE.ps \
'name="series_cnt_RMSE"; level="(*,*)";'
The successful run of that command should produce an image. view it with the following command: