Histogram Overview:
The histogram source code is located in the https://github.com/dtcenter/METplotpy repository, under the METplotpy/metplotpy/plots/histogram directory. Custom configuration files and sample data are located under the METplotpy/test/histogram directory.
There are three specialized histogram plots available:
- Rank Histogram
- Relative Frequency Histogram
- Probability Histogram
Detailed information about these plots is available from Read the Docs:
https://metplotpy.readthedocs.io/en/latest/Users_Guide/histogram.html
These instructions are relevant for generating the rank histogram from the command line. For METplotpy version 2.0, development was performed with Python 3.8 and related third-party packages (i.e. Python packages outside the Python standard library).
Each histogram plot requires two configuration files, a default and custom configuration file in YAML (https://yaml.org/). One default configuration file is used for all three histogram plots: histogram_defaults.yaml. This default configuration file is automatically loaded by the source code. The custom configuration file is useful for overriding the default settings in the histogram_defaults.yaml configuration file. If the user chooses to use all the settings in the default configuration file, an empty custom configuration file can be provided (however, the user will have the sample data and output plot located in the specified directories set in the default configuration file- some users may not have permission to do this) . The custom configuration files and sample data are located in the METplotpy/test/histogram directory of the downloaded/cloned source code.
Set up pre-requisites:
The Python requirements for METplotpy are found in the User's Guide, under the Installation section
METcalcpy is a requirement for METplotpy. The following description is one of numerous methods to set up the working environment to utilize METcalcpy from the METplotpy source code. These instructions are suitable for users that are not working within a conda environment:
- Method 1: Follow instructions in Section 1.1.2 of the Installation section of the METplotpy User's Guide
- Method 2: Using using PyPI (Python Package Index) enter the following:
Clone the METplotpy repository to a directory where you have read/write permissions (replace /path/to/code with the full path to where you are saving the METplotpy source code):
Create the Rank Histogram plot:
Overview of steps:
-
create a WORKING_DIR where you have read/write permissions
-
set the PYTHONPATH, WORKING_DIR, and METPLOTPY_BASE environments
-
copy the histogram data to the WORKING_DIR
-
copy the custom configuration for the rank histogram to the WORKING_DIR
-
modify the location of the input data and output plot in the custom configuration file
-
run the Python script to generate the rank histogram plot
replace /path/to/working_dir with the path leading to the working directory.
csh:
bash:
csh:
bash:
Modify custom configuration file:
Save and close the rank_hist.yaml file.
In your WORKING_DIR, you will now see a rank_hist.png file. You can view the png file using an appropriate viewer, such as 'display' if on a Linux/Unix host:
Your histogram will look like the following:
![]()
Create the Relative Frequency Histogram and Probability Histogram
Relative frequency histogram:
Probability histogram:
Relative frequency histogram:
Probability histogram:
Relative frequency histogram:
Probability histogram:
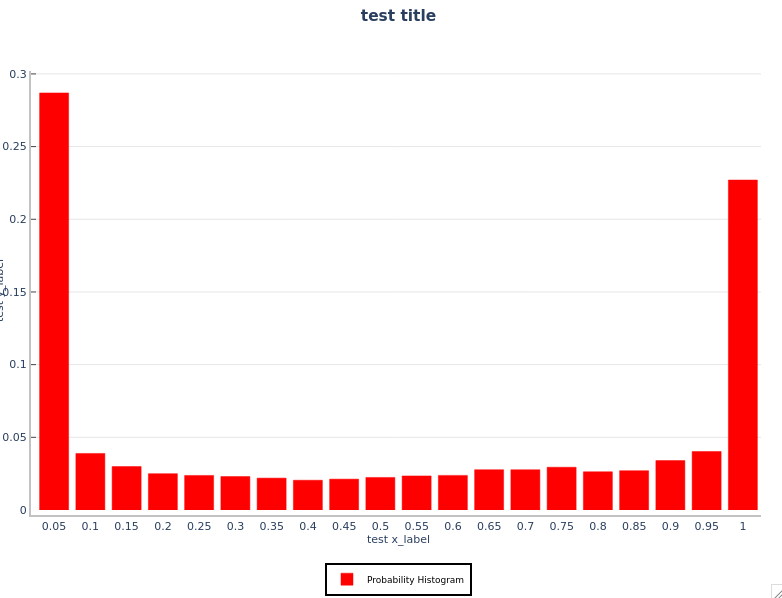
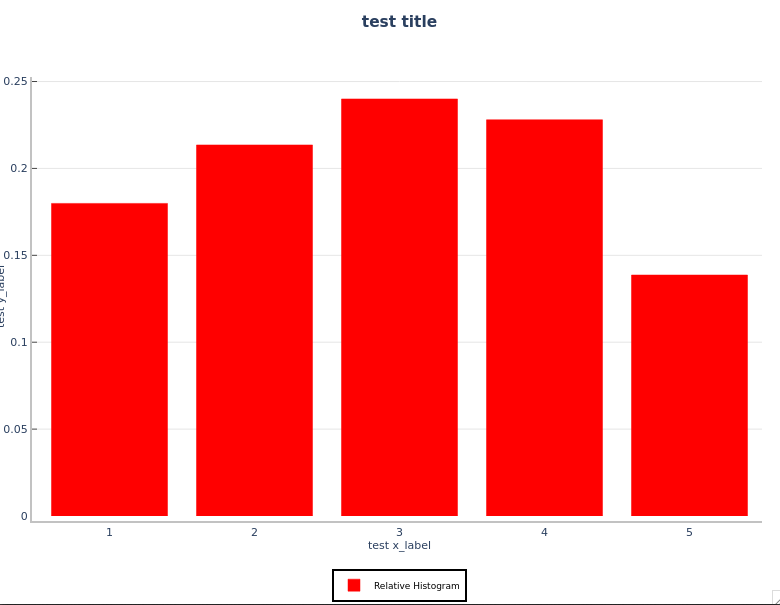
You will see the rel_hist.png and prob_hist.png files in your WORKING_DIR. Your plots will look like the following:
Relative Frequency Histogram:
Probability Histogram: