2021 DTC UFS Evaluation Metrics Workshop | Pre-Workshop Survey 3


To help with understanding Statistical Options, here are some links to descriptions based on :
Continuous Statistics (values change smoothly across a region):
https://www.cawcr.gov.au/projects/verification/#Methods_for_foreasts_of_continuous_variables
Categorical Statistics (did event occur or not):
https://www.cawcr.gov.au/projects/verification/#Methods_for_dichotomous_forecasts
Multi-Category Statistics (3 or more discrete values):
https://www.cawcr.gov.au/projects/verification/#Methods_for_multi-category_forecasts
Spatial Methods: https://www.cawcr.gov.au/projects/verification/#Methods_for_spatial_forecasts.
Also, please refer to the METplus MODE attributes description to help with answering this question. Description can be found at: https://dtcenter.org/sites/default/files/events/2021/metrics-workshop/MODE_Attributes.pdf
Probability and Ensemble Statistics:
https://www.cawcr.gov.au/projects/verification/#Methods_for_EPS
Rare Events:
https://www.cawcr.gov.au/projects/verification/#Methods_for_rare_events
Survey 3 is broken up into 9 surveys with 6-20 subsections per application and may take 5-20 minutes to complete. We have already identified critical fields, levels, and temporal attributes. Through this survey, we are trying to identify what are the critical: 1) Statistics; 2) Thresholds; 3) Regions and 4) Sources of "Truth". Please follow the links to the surveys for each application. You only need to take the surveys to which you feel comfortable responding.
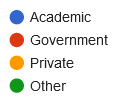
| UFS APPLICATION | RESPONSE BY SECTOR (UPDATED 2/19) | |
|---|---|---|
SHORT RANGE WEATHER /
|
 |
|
MEDIUM RANGE WEATHER |
||
SUB-SEASONAL and SEASONAL |
||
AIR QUALITY/COMPOSITION |
||
CRYOSPHERE |
||
DATA ASSIMILATION |
||
HURRICANE |
||
MARINE AND COASTAL |
||
SPACE |
Copyright © 2026. All rights reserved.