Transitions Newsletter Header

Issue 30 | Summer 2022

Lead Story

Advances in the Rapid-Refresh Forecast System as Seen in NOAA’s Hazardous Weather Testbed’s Spring Forecasting Experiment

Contributed by Burkely T. Gallo, OU CIWRO/NOAA SPC

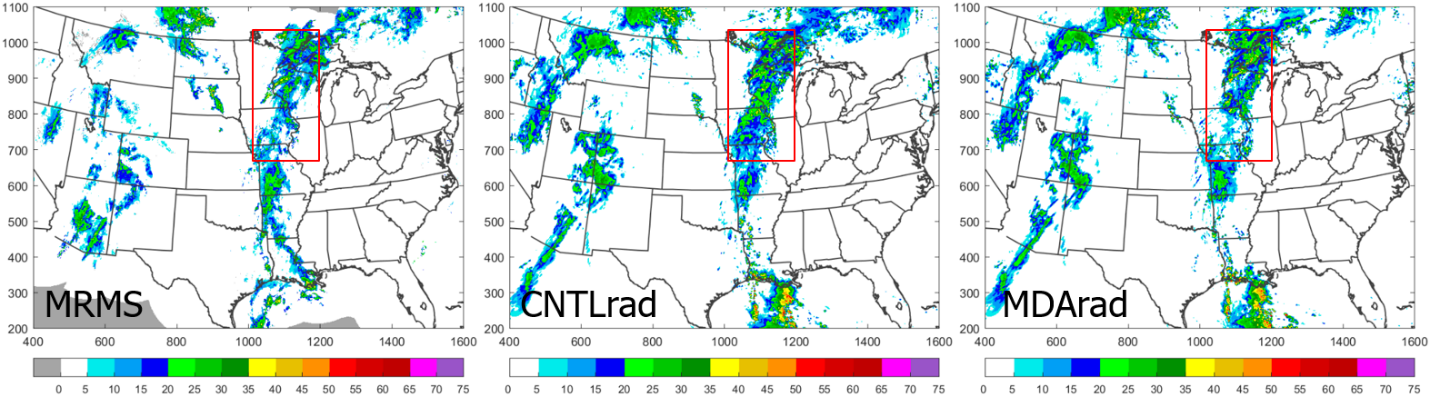
The Rapid Refresh Forecast System (RRFS) is a critical component of NOAA’s Unified Forecasting System (UFS) initiative which has been in development for several years and is planned for operational implementation in late 2024. The RRFS will provide the NWS an hourly updating, high-resolution ensemble capability that uses a state-of-the-art, convective-scale ensemble data assimilation and forecasting system with the Finite-Volume Cubed Sphere Dynamical core (FV3). Further, the RRFS will greatly simplify NCEP’s model production suite by subsuming several regional modeling systems such as the North American Mesoscale model (NAM), the Rapid Refresh (RAP), and the High-Resolution Rapid Refresh (HRRR), which is a significant step forward for the UFS vision to unify development efforts around a simplified and streamlined system. Since 2018, Spring Forecasting Experiments (SFEs) in NOAA’s Hazardous Weather Testbed have played an important role in evaluating convective scale FV3-based model configurations for severe weather forecasting applications. Each year, more and more model configurations utilizing the FV3 dynamical core have been evaluated during the SFE, and SFE 2022 was no exception. With contributions from multiple agencies, 59 FV3-based model configurations were contributed to the 2022 SFE, up from 24 FV3-based model configurations in 2021 and 10 FV3-based model configurations in 2020. This increase is in part due to multiple agencies, such as the University of Oklahoma’s Multi-scale data Assimilation and Predictability (MAP) group, running ensembles to determine how to best configure a future RRFS.

Feedback was provided to the developers through multiple methods during the SFEs. Formal evaluations were conducted, asking participants to subjectively evaluate convection-allowing model and ensemble performance in forecasting severe convective weather such as tornadoes, hail, and winds. Feedback was also collected on the specific aspects of model performance that the developers were interested in, such as how well models using different data assimilation schemes depicted ongoing storms an hour into the forecast. In 2022, for the first time in the SFE, blinded evaluations were conducted so participants did not know which model configuration was used. Blinding the evaluations and randomly displaying the configurations removed any bias participants had toward or away from certain configurations based on name alone.

Spring Forecasting Experiments (SFEs) in NOAA’s Hazardous Weather Testbed. Photo credit NOAA/James Murnan.


Feedback from these subjective evaluations gave developers clues as to which elements to target to improve the forecast performance. For example, in SFE 2021, participants noted that storms in some configurations were overly circular in nature, indicating strong isolated updrafts. Developers were able to adjust the configurations in the off-season, thus this issue was not flagged in SFE 2022. Subjective evaluations can also provide developers with the best avenue of attack for new model developments. In SFE 2021, a Valid-Time-Shifting (VTS) approach in the RRFS configurations contributed by the OU MAP group was tested versus a more traditional data assimilation method. The subjective evaluations indicated that the VTS improved the subsequent forecasts, as did objective verification performed after the SFE by the MAP group. Therefore, for SFE 2022, all MAP RRFS configurations used VTS assimilation, so the focus shifted to determining which observations a VTS approach should be applied to for the greatest forecast benefit.

SFEs have often encompassed comparisons between currently operational model configurations and the next generation of model guidance. In SFE 2022, deep-dive comparisons were conducted between the High-Resolution Ensemble Forecast System (HREF) and the RRFS prototype 2 ensemble (RRFSp2e), and the High-Resolution Rapid-Refresh version 4 (HRRRv4) and the RRFSp2e Control member (RRFSp2 Control). These comparisons considered not only the typical fields utilized for severe weather, but also the environmental mean fields for the ensembles, and upper-air fields for the deterministic comparison. Results from these comparisons revealed which aspects of the guidance were performing better in the newer iterations of the models, and which aspects are still best-depicted by the operational guidance (Figures 1 and 2).

Participant evaluations of the HREF and RRFSp2e forecasts of mean 2-m Temperature, mean 2-m Dewpoint, mean SBCAPE, and probabilities of UH exceeding the 99.85th percentile
Answers to the question, “Which model configuration performed best for this field?”, in which participants were asked to select at least two of the five fields presented to evaluate.


Over the years that the SFE has evaluated FV3-based configurations, evolving toward the future RRFS, we have seen great improvement in the configurations contributed to the SFE. Results from SFE 2022 show the skill of the RRFS and its control member approaching the skill of the HREF and the HRRR. These advancements would not be possible without the dedicated efforts of a community of developers implementing feedback from participants across the meteorological enterprise who contribute their evaluations to the SFE each year.

Burkely T. Gallo. Photo credit NOAA/James Murnan.


Director's Corner

The era of funky grids, influence of interpolation, and the importance of community verification codes

Marion Mittermaier
Contributed by Marion Mittermaier, UK Met Office

Model intercomparison has always come with challenges, not least of all, the decisions such as which domain and grid to compare them on and the observations to compare them against. The latter also involves the often “hidden” decision about which interpolation to use. We interpolate our data almost without thinking about it and forget just how influential that decision might be. Let’s also add the software into the mix, because, in reality we need to. In 2019 the UK Met Office made the decision to adopt METplus as the replacement for all components of verification (model development, R2O, and operational). Almost three years into the process, we know that despite the fact that we have two robust and well-reviewed software systems, the two systems do not produce the same results when fed the same forecasts and observations, yet both are correct! The reasons why this may be the case can be many and varied, from the machine architecture we run them on, the languages used (C++ and Fortran), and even whether you use GRIB or netCDF file format.

It brought to mind the World Meteorological Organisation (WMO) Commission for Basic Systems (CBS) exchange of verification scores (deterministic and ensemble) where, despite having some detailed instructions of what statistical scores to compute and how to compute them, each global modelling centre computes them using their own software. In essence the scores are comparable, but they are not as comparable as we might believe. The only way they would be comparable on all levels is if the forecasts and observations were put through the same code with all inputs processed identically. Community codes, therefore, form a vital link in model-intercomparison activities, which is a point we may not have thoroughly considered. In short, common software provides confidence in the process and the outcomes.

The next-generation Model for Prediction Across Scales (MPAS) grid


Cue the “cube-sphere revolution,” as I have come to call it. Europe, in particular, has been in the business of funky grids for a long time (thinking of Météo France’s stretched and Met Office’s variable resolution and German Weather Service’s (DWD) icosahedral grids). The next-generation Model for Prediction Across Scales (MPAS) and FV3 make use of unstructured grids (e.g. Voronoi and cube-sphere meshes, respectively) and the Met Office future dynamical core is also based on the cube-sphere. Most of these grids remove the singularity at the poles primarily to improve the scaling of codes on new HPC architectures. These non-regular grids (in the traditional sense) bring new challenges. Yes, most users don’t notice any difference because forecast products tend to be interpolated onto a regular grid before they see or interact with them. However, model developers want to assess model output and verification on the native grid because interpolation (and especially layers of) can be very misleading. For example, if the cube-sphere output is first interpolated onto a regular latitude-longitude raster coordinate system (to make it more manageable), that’s the first layer of interpolation. If these interpolated regular gridded fields are then fed into verification software such as METplus and further interpolation to observations is requested, then that’s the second layer of interpolation. In this instance, the model output has been massaged twice before it is compared to the observations. This is not verification of the raw model output anymore. However, shifting the fundamental paradigm of our visualisation and verification codes away from a structured and regular one is a challenge. It means supporting the new UGRID (Unstructured Grid) standard, which is fundamentally very different. Just as the old regular grid models are not scalable on new HPC architectures, the processing of unstructured grids doesn’t scale well with the tools we’ve used thus far (e.g. python matplotlib for visualisation). New software libraries and codes are being developed to keep pace with the changes in the modelling world.

As the models change and advance, our tools must change as well. This can’t happen without significant investment, and can be a big ask for any single institution, further underlining the importance of working together on community codes. The question is then how fast we can adapt and develop the community codes so that we can support model development in the way we need to.

Marion Mittermaier


Who's Who

Will Mayfield

Will Mayfield began working with the DTC as a co-lead on the Data Assimilation (DA) team. His project focused on the Gridpoint Statistical Interpolation (GSI) software. However, he recently transitioned into a co-lead for two projects: the Unified Forecast System (UFS) Short Range Weather (SRW) App support as well as Ensembles Testing and Evaluation. Successfully executing these roles demands a balance of software support, investigative science work, and project management. He has also collaborated on a variety of other projects including statistical evaluation of observation operators for DA, assessing GPS-RO observation errors, and testing stochastic physics schemes in the UFS. Staying ahead of the vast array of software and approaches used in numerical weather prediction is both challenging and thrilling to him, but the best thing is being part of all the fresh work being done with emerging tools.

Will’s life started in Stephenville, a small city in north-central Texas, where he grew up and eventually attended Tarleton State University. He majored in English and Languages (and then earned an MA), and also studied mathematics. His first project in computational modeling was lunar-forming giant impact simulations using particle approaches—watching the particles coalesce into a moon was fascinating. He enjoyed both the arts and humanities as well as sciences, but he ultimately chose to pursue a career in math and science. This decision led to his grad school experience at Oregon State University in Corvallis where he worked in Applied Mathematics and discovered his interest in the geoscience disciplines, including research on tsunami forecasting and uncertainty quantification for coastal hazards.

Although he didn’t know much about meteorology at the time, he’d always been interested in large-scale physical models. So joining the DTC and learning about weather forecasting was a terrific opportunity to dive into his newly discovered pursuit. Will says, “The atmosphere is such an immense, dynamic system that I’m constantly in awe of all the detail that goes into making good forecasts, and how creative the solutions are to all the problems we encounter.”

As much as he enjoys his work for the DTC, it’s possible that his most rewarding role is mentorship. This summer he was lead mentor to a student as part of the NESSI (NCAR Earth Science System Internship) program. It was a fun and rewarding experience that he hopes to have again in the future. He also participates in the NCAR mentoring program. Through his DTC roles, he’s also hosted a number of visitors, including Ivette Hernández Baños, a PhD student from Brazil, and Chong-Chi Tong, a researcher from the University of Oklahoma Center for Analysis and Prediction of Storms (CAPS) who visited on site at NCAR for October 2021. Both were great collaborations during which he supported their work, and in turn, drew invaluable experience from theirs as well.

Will Mayfield -- Mt St Helens summit


So, what does his life outside of work look like? Like most of us in Colorado, he hikes, bicycles, backpacks/camps, swims in lakes, occasionally fishes, and reads fiction of all kinds. He recently stepped into the popular pickleball fray. As for bucket-list pursuits, he’d like to return to Big Bend National Park to watch the Geminids meteor shower because it was cloudy the last time he tried. As for travel wishes, why not Kamchatka? It holds a special place in his family history because it was the most hotly contested location in family games of “Risk.” For those of you who have never heard of this board game, it’s a game of strategy, diplomacy, conflict, and conquest. Evidently, it’s the sort of game that stirs competition between family members that forges indelible memories.

Will Mayfield -- kayaking, Patterson Lake, Washington


Bridges to Operations

Creation of an Agile RRFS Prototype Testing Framework to Inform and Accelerate Operational Implementation

Contributed by DTC staff: Jeff Beck, NOAA & Michelle Harrold, NCAR

Within the effort to unify the NCEP operational model suite, taking place under the Unified Forecast System (UFS) umbrella, a key area of interest is the evolution of legacy operational, convective-allowing systems to a new, unified Finite-Volume Cubed-Sphere (FV3)-based deterministic and ensemble storm-scale system called the Rapid Refresh Forecast System (RRFS). The ongoing transition from the existing NOAA NWP systems to the UFS is a major multi-year undertaking, with the RRFS targeted for initial operational implementation in late 2024. As part of the UFS, a new model-development paradigm is taking shape that focuses human resources and expertise from across the meteorological community on fewer systems, allowing for effective model development, and ultimately improved forecast skill, across the full NCEP modeling suite. In addition, simplification of the operational NCEP suite will optimize existing and future high-performance computer resources as well as reduce the overhead associated with maintaining multiple systems.

In order to successfully replace legacy regional prediction systems (i.e., the NAM nests, HREF, RAP, and HRRR) in favor of a single regional, convection-allowing ensemble, a phased retirement approach will be necessary and employed to ensure that the RRFS performs on par with each convective-allowing model. Progression toward an eventual operational implementation of the RRFS requires coordinated development across several, interconnected areas spanning the dynamic core, data assimilation, and chosen physics suite. Integral throughout this process is careful objective and subjective diagnostic analysis of forecast output in the forms of case studies and metrics as development of the RRFS evolves. In addition, continued engagement of model-development groups across NOAA, academia, the private industry, and input from stakeholders and end users is critical. To this end, a testing and evaluation framework is needed to incrementally assess various innovations from the community in a thorough and transparent manner, as model development is evaluated for potential inclusion in the RRFS.

The preliminary 3-km RRFS computational domain (shown in red), with initial plans for output grids (blue).


In preparation for this work, the DTC has been partnering and collaborating closely with teams including the UFS-R2O Short-Range Weather/Convection-Allowing Model (SRW/CAM) sub-project and several additional UFS-R2O cross-cutting teams to address the need of assessing RRFS performance.

As part of this initiative, the DTC recently completed a thorough comparison of the GFS versus the NAM and RAP using METviewer scorecards to inform the beginning stages of the legacy regional model retirement process. For the upcoming year, the DTC’s role in the UFS-R2O SRW/CAM sub-project will continue by establishing and exercising an agile benchmark testing framework through which output from end-to-end RRFS prototypes can be quickly verified using standard observational data and compared to verification of the operational CAM-based regional systems. This verification capability will be modeled after the coupled system, benchmark testing paradigm currently being used for global system evaluations at EMC, and will be run over important RRFS retrospective periods large enough for statistical significance, but small enough to allow for rapid prototyping and turnaround. The ability to iteratively evaluate RRFS prototypes against both observations and legacy, operational systems will provide model developers with not only a baseline for the current RRFS prototype, but also the ability to identify future development work and areas for potential innovation on a timely basis, crucial for an on-time delivery of the RRFS into operations in FY24. Regular evaluation of RRFS prototypes will also allow the community to participate through continuous engagement, facilitating collaboration from across the weather enterprise.

Extensive SRW App development has taken place over the past year, including integration of the advanced Model Evaluation Tools (METplus) into the App workflow, the result of several DTC testing and evaluation (T&E) projects. Using recent advances in the workflow, as well as new verification functionality established in these efforts, work on an RRFS agile testing framework will begin with the goal of providing this framework to the community by the spring of 2023. To this end, Agile framework development will be contributed to the authoritative SRW App repository for future distribution through the develop branch as well as in an upcoming release of the SRW App. It will also facilitate evolving prototype T&E activities. The successful implementation of the RRFS will depend on using the framework to rapidly evaluate multiple prototypes, an effort that will be based on both DTC evaluation and collaborative engagement of the weather community to take part in testing subsequent prototypes. One potential avenue for this kind of community engagement is the DTC Visitor Program.

Flow chart illustrating the model development and testing paradigm that the agile framework will be facilitating.


Visitors

Development of GSI Multiscale ENKF Data Assimilation for Convection-Allowing FV3 Limited Area Model

Visitor: Chong-Chi Tong

Accurately predicting weather down to the convective storm scales requires setting initial model conditions that accurately represent the atmospheric state at all scales (from the planetary through synoptic large-scale, mesoscale, to convective). The importance of these various interactions can not be overlooked.  A well-performing data assimilation (DA) system must accurately analyze flow features at all scales. For this visitor project, a multi-scale DA capability within the GSI-based Ensemble Kalman Filter System (EnKF) system was proposed for the FV3 limited-area model (LAM) that can assimilate both dense convective-scale data, such as those of radar and high-resolution GOES-R observations, as well as all other coarser-resolution data. The operational GSI hybrid Ensemble Variational (EnVar) system was recently selected to work with the FV3 LAM system that runs at NCEP which does not yet have a self-consistent multi-scale EnKF system. The EnKF is a prerequisite for an optimal multi-scale hybrid EnVar system because EnKF is essential to provide ensemble perturbations for reliable flow-dependent covariance estimation.

For the planned operational use of  the FV3 LAM for convection-allowing model (CAM) forecasts over CONUS or larger domains, the multi-scale DA issue must be properly addressed. Two main goals proposed for this visitor project were to:  

  1. develop a GSI-based multiscale EnKF DA system capable of effectively assimilating all observations sampling synoptic through convective scales for balanced NWP initial conditions on a 3-km continent-sized CAM-resolution grid, and 
  2. test the multiscale DA system coupled with FV3 LAM using retrospective cases, tune and optimize the system configurations, including the filter separation length scale, localization radii, covariance inflation, etc.
The advantageous performance of MDA on the prediction of storm systems, mostly in reducing overforecast in both coverage and intensity, over the regular single-scale EnKF experiment. The positive impact of the MDA was found to be even more significant in the performance of individual ensemble members as well as the ensemble average.

The proposed multiscale DA (MDA) method uses filtered background covariances with long localization lengths for assimilating conventional observations that sample synoptic to meso-scale perturbations. Sensitivity experiments were performed to determine ideal filtering-length scales sufficient to diminish unfavorable noise in analyses. In addition, the height-dependent filtering length was proposed and its impact was examined with one-time upper-air data assimilation; the benefit was evident for up to 24 hours in subsequent forecasts, particularly for prediction of humidity. The post inflation in the GSI, relaxation to prior spread (RTPS), was optimized accordingly for MDA to restore only the large-scale background perturbations, which prevents reintroducing small-scale noise in analyses. The MDA was examined with a hourly cycled update configuration for 12 hours for real cases and its impact was evaluated. In terms of the deterministic forecasts from the final ensemble mean analysis, consistent improvement of MDA was found in prediction of most variables for up to 48 hours when only assimilating conventional data; when including radar DA, the benefit of MDA was relatively limited on the storm prediction and humidity forecast, for a shorter lead time. The figure below gives an example of the advantageous performance of MDA on the prediction of storm systems, mostly in reducing overforecast in both coverage and intensity, over the regular single-scale EnKF experiment. The positive impact of the MDA was found to be even more significant in the performance of individual ensemble members as well as the ensemble average. Our ongoing work will apply the MDA method to more cases to support a statistically robust conclusion.

Figure: 12-h forecast composite reflectivity, valid at 1200 UTC 21 May 2021, for CNTL (middle) and MDA (right) experiments with both conventional and radar reflectivity DA, as compared with the MRMS observation (left).


It has been a precious experience to work under the DTC Visitor Program, especially during the critical pandemic period. During the one-month on-site visit period, I was able to collect all the data necessary for the planned retrospective experiments with assistance from the DTC Data Assimilation team. Valuable input toward the work was provided by regular weekly meetings with DTC members Drs. Ming Hu and Guoqing Ge, the program host Mr. Will Mayfield, and Ivette Hernandez (also a visitor, but on another project) throughout the entire one-year Visitor Program period.

Chong-Chi Tong


Community Connections

International Community Participates in First METplus Users’ Workshop

Contributed by John Opatz, Tara Jensen, Keith Searight

The first DTC METplus Users Workshop was held virtually June 27th through June 29th, 2022 covering a multitude of topics and application areas. METplus became an operational software tool for NOAA NCEP Central Operations in 2021 and provides a framework for all components needed to provide ease-of-use and diagnostic capability to the Model Evaluation Tools (MET) package first released by the DTC in 2008, which originally began through and continues to benefit from the generous support of the Air Force. The last MET Workshop was hosted in 2010 and was focused on the core tools housed within MET. Much has changed since then and the committee developed the workshop agenda with goals of building the METplus community and inspiring external contributions to the development of the verification system, with special attention paid to planning future verification and diagnostic frameworks. The workshop garnered tremendous interest with 250 registered participants. Users were actively involved during the workshop, with presentations on ways they have used METplus in forecast verification and diagnostic activities. Thirty METplus community members from across the globe represented various NOAA centers (EMC, CPC), the UK Met Office, India’s National Centre for Medium Range Weather Forecasting (NCMRWF), the Australian Bureau of Meteorology, as well NCAR’s AAP and JNT, ICDP (UCAR’s International Capacity Development Program), and NOAA GSL. METplus community members from these groups gave 15- to 20-minute presentations about various METplus tools and product capabilities.

Users of all experience levels were engaged, with the METplus development team providing top-level overviews of the verification system on the opening day and condensing the newest capabilities of METplus in easy-to-understand presentations. Parallel sessions were conducted throughout the workshop to maximize the community presentation time, enabling attendees to select the sessions they were most interested in. For those interested in seeing all of the sessions, recordings of the workshop are available on the Workshop website and the presentation slides are available from the Workshop Google Drive folder.

The workshop also went beyond presentations by engaging all participants directly through the use of online surveys during session breaks to collect and address accessibility issues and outline opportunities for success in future releases of the verification suite. The second and third days of the workshop provided attendees with the unique opportunity to receive one-on-one assistance via a virtual METplus help desk hosted by a METplus team member.

2022 METplus Workshop attendees by affiliation


The final day of the workshop culminated in a sneak-peek at upcoming and in-development tasks that will be coming in the next METplus Coordinated Release (version 5.0.0), as well as two rounds of small breakout groups focused on five topics in which attendees provided feedback on current activities and future development. The METplus development team was grateful for the opportunity to engage with such a large part of the verification community and will continue to find ways to build engagement with the community and strengthen the METplus suite to advance its mission.


Did you know?

The METexpress Visualization Suite

Contributed by Molly Smith and Keith Searight - NOAA

A major advancement of the Unified Forecast System Research-to-Operations (UFS-R2O) project has been the implementation of the DTC’s advanced Model Evaluation Tools (METplus) as a unified verification system for community model-development efforts. A community verification tool is important for this sort of decentralized development endeavor, as it gives all participants a common framework for evidence-based decision making when transitioning these models to operations. METplus processes numerical weather prediction output and matched “truth data” (which includes observations, analyses, tropical cyclone tracks, etc.) into a standardized format, which is then stored in a relational or document database. As a way to retrieve and visualize this stored data, the NOAA Global Systems Laboratory (GSL) and the DTC have collaboratively developed METexpress, a lightweight, quick-start visualization suite, a component of the overall METplus package. METexpress comprises eight individual apps, each designed to verify a particular meteorological facet, and features an intuitive interface with which users can quickly produce interactive graphs of common plot types.

The METexpress user interface.


The applications currently included are:

  • MET Upper Air–Displays scalar and vector statistics for upper air fields on isobaric levels.
  • MET Anomaly Correlation–Displays anomaly scalar and vector statistics.
  • MET Surface–Displays scalar and vector statistics for surface fields on surface levels.
  • MET Air Quality–Displays scalar and contingency table statistics for air quality fields on surface levels.
  • MET Ensemble–Displays ensemble and probabilistic statistics for various fields.
  • MET Precipitation–Displays scalar, contingency table, EV, and FSS statistics for precipitation fields.
  • MET Cyclone–Displays statistics specific to tropical and extratropical cyclones. Users can examine specific ocean basins, years, and storms.
  • MET Objects–Displays MODE statistics for various fields.

These applications are able to present METplus data in numerous plot types, including timeseries (time on x-axis), profile (vertical level on y-axis), dieoff (forecast lead time on x-axis), valid time (hour of the day on x-axis), threshold (threshold on x-axis), grid scale (grid scale on x-axis), year-to-year plots (yearly averaged timeseries), histogram, ensemble histogram, reliability curve, ROC diagram, performance diagram, and contour.

METexpress is a component of the overall METplus package.


METexpress has transitioned to operations within the NWS Environmental Modeling Center (EMC) (https://metexpress.nws.noaa.gov), and with NOAA GSL’s in-house model developers (https://gsl.noaa.gov/mats). METexpress, like the rest of METplus, is open source, and our hope is that, as more features are added, its use continues to expand amongst the UFS-R2O community, and to other public- and private-sector entities, aiding the development of new, next-generation models.

For more information about METexpress, please visit https://dtcenter.org/community-code/metexpress or email mats.gsl@noaa.gov.

Sample METexpress plots.


Software Release

UPP V10.1.0 Release

The Developmental Testbed Center (DTC) is pleased to announce the release of the Unified Post Processor Version 10.1.0.  This release can be used in standalone mode and is also the version to be used as the post processor component in the upcoming UFS Short Range Weather (SRW) and Medium Range Weather (MRW) Application releases.  

Release Highlights

Since the last public release was announced, a number of features have changed, notably:

  • HPC-stack is used for prerequisite NCEPLIBS libraries

  • NEMSIO format is no longer supported

  • The itag was updated to be a formal Fortran namelist

Development and internal releases continued after the previous public release. Updates to this specific release include:

  • Unification of the global and regional FV3 interfaces and use of parallel NetCDF

  • Updates to the User Guide

  • Several bug fixes

  • Significant efforts to translate existing source code to Doxygen

  • Details about updates included in this release can be found on the GitHub releases page.

User Support

User help questions may be posted to the online UFS forum:

https://forums.ufscommunity.org/forum/post-processing

Questions may also be posted to the GitHub repository Discussions Board: 

https://github.com/NOAA-EMC/UPP/discussions

The UPP Users' Guide for this release can be found at: https://upp.readthedocs.io/en/upp_v10.1.0/

Technical code-level documentation: 

https://noaa-emc.github.io/UPP/

Download Information:

The preferred method for obtaining the code is to clone the release from GitHub.  Please visit the download page for links and more release information: https://dtcenter.org/community-code/unified-post-processor-upp/download.


This release is the result of the joint efforts of NOAA/NCEP and DTC through the support of NOAA and the National Science Foundation (NSF). We would like to thank contributors from NCEP, the DTC, and from the user community who have contributed to this release. 


Best Regards,

The UPP Team