The National Oceanic and Atmospheric Administration (NOAA) has developed a new Hurricane Analysis and Forecast System (HAFS) to improve tropical cyclone prediction. Two configurations of HAFS, HAFSv1a (HFSA) and HAFSv1b (HFSB), have been operational since 2023. The main difference between these configurations is their microphysics schemes, which are expected to significantly influence their ability to predict clouds, hydrometeors and rainfall from tropical cyclones.
Predicting precipitation from tropical cyclones is a crucial skill, as flooding from extreme rainfall is a major hazard causing over a quarter of cyclone deaths. However, previous model-validation efforts have primarily focused on track and intensity forecasts rather than precipitation. This study aims to address this gap by evaluating the cloud-physics forecasting skill of the two HAFS configurations.
The study uses remote-sensing data from GOES-R satellites, which provide high-resolution infrared images of the hurricanes. These observed images are compared with synthetic satellite images generated from the model data using the Community Radiative Transfer Model (CRTM). The CRTM converts the model data, including atmospheric temperature, moisture profiles, surface properties, and hydrometeor characteristics, into synthetic satellite images that can be directly compared with the observed images.
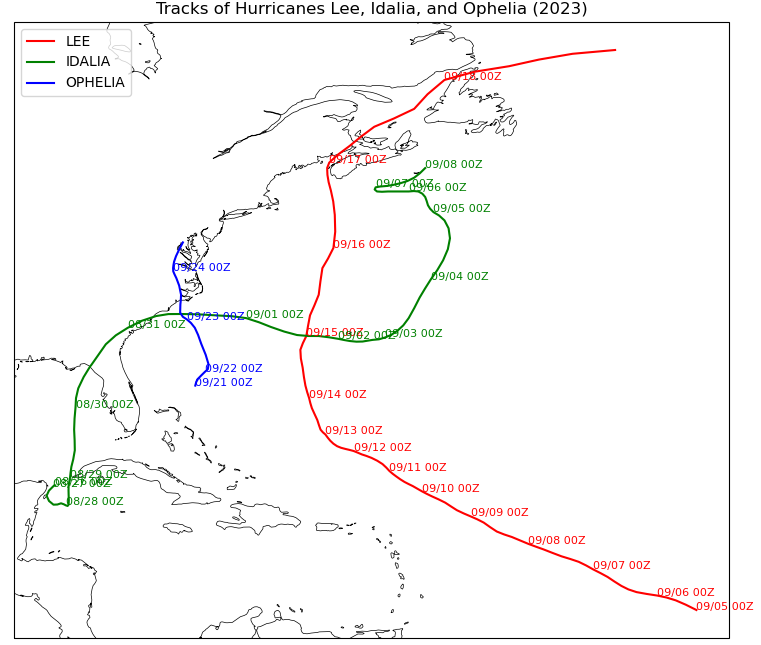
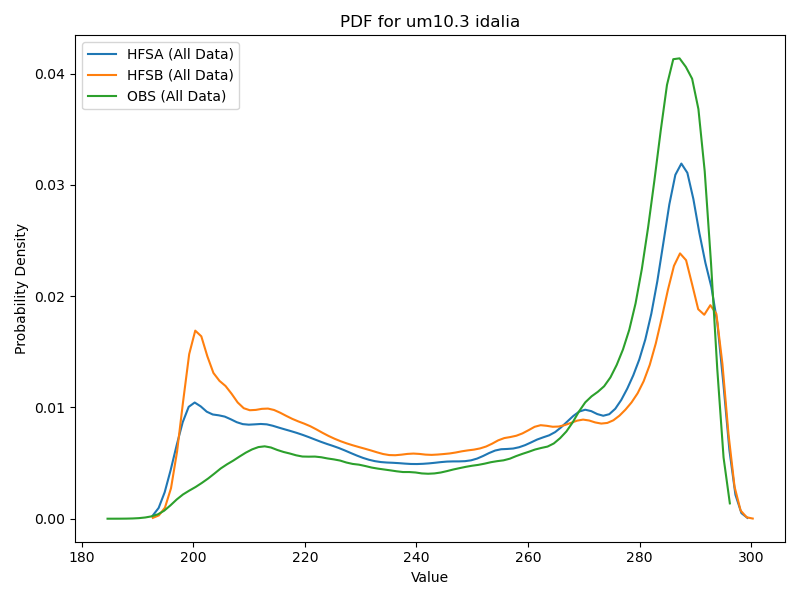
Three 2023 Atlantic hurricanes were used as case studies (Fig 1): Lee, Idalia, and Ophelia. The study employed various statistical methods to compare the model output with the observed data. Probability density functions (PDFs) were used to analyze the distribution of brightness temperatures, revealing that both HFSA and HFSB overestimate cloud coverage and the extent of cold cloud tops compared to the observed data (Fig 2).
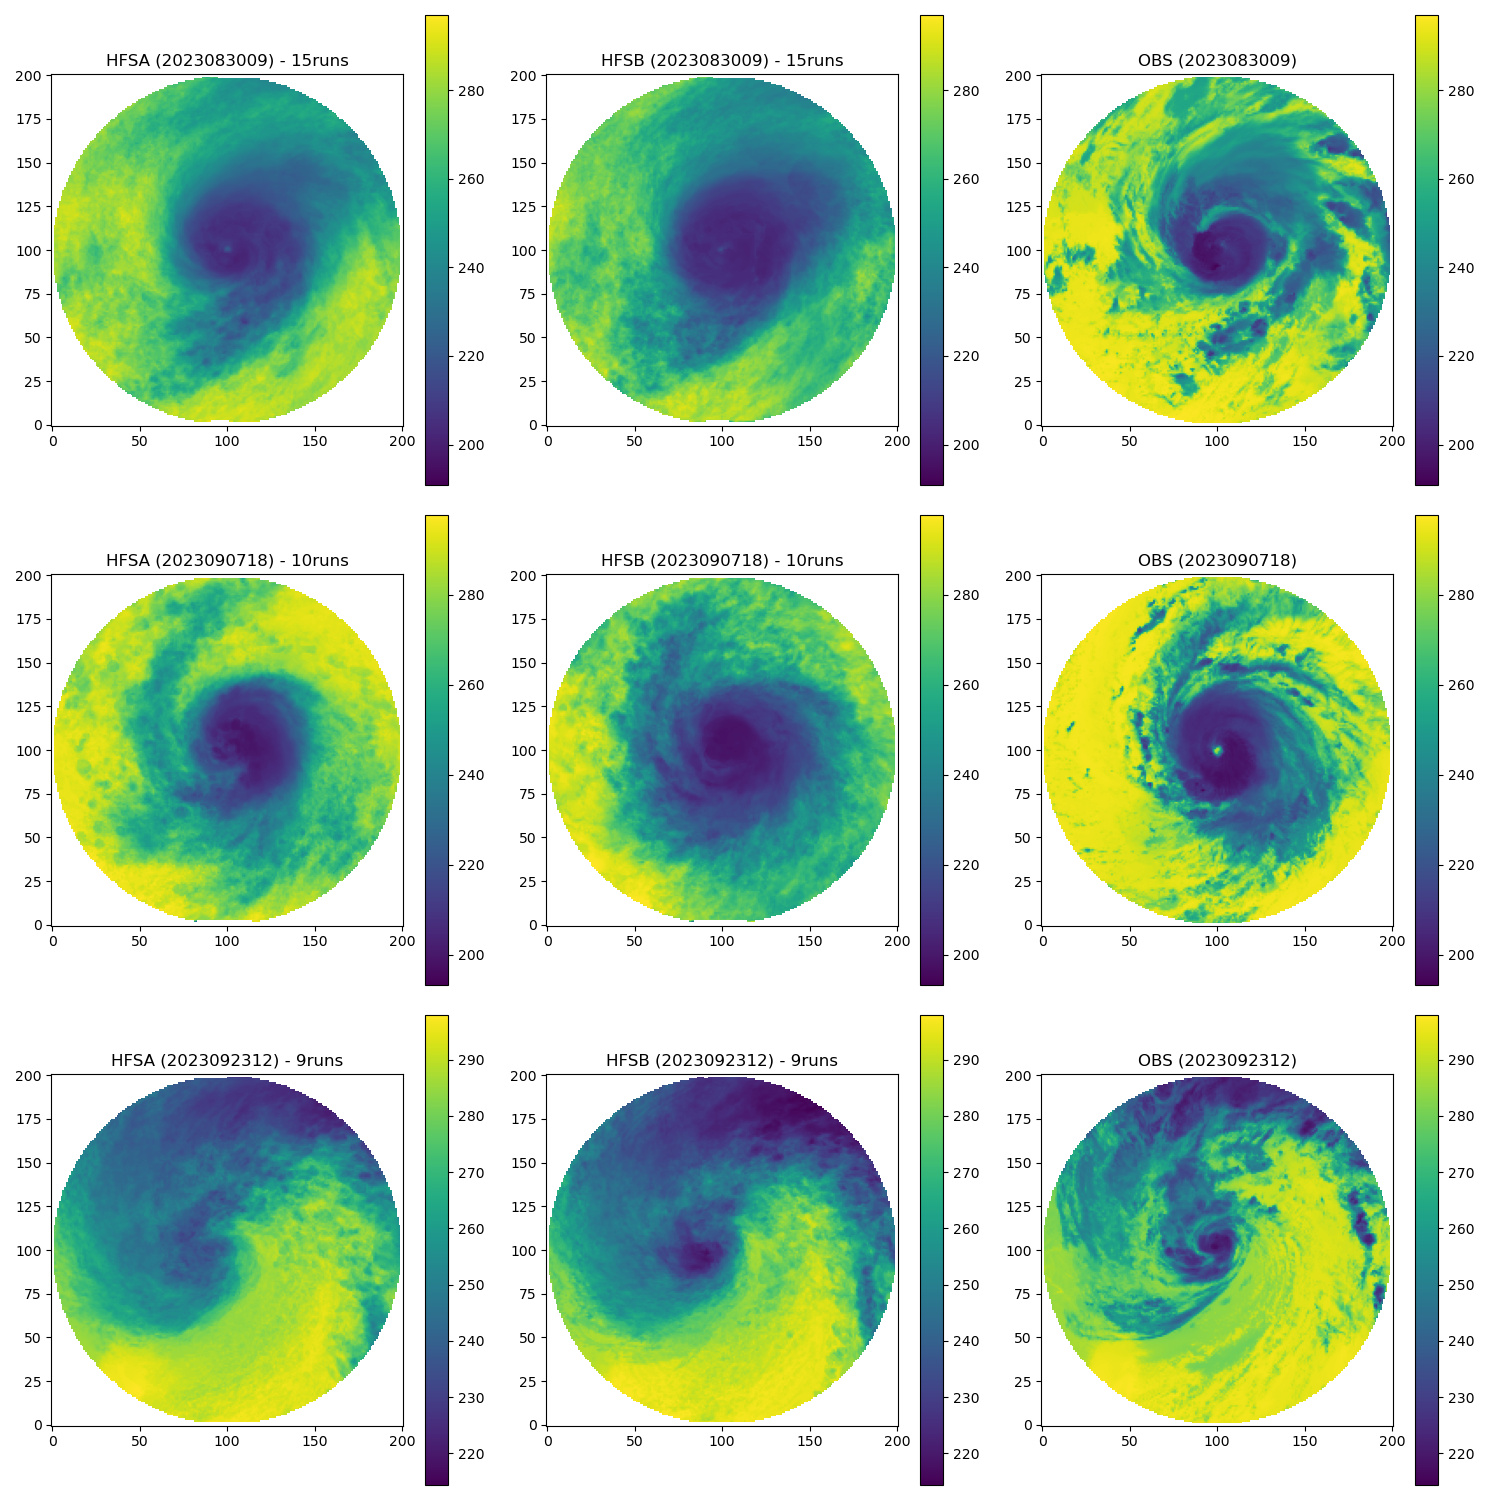
Composite images (Fig 3) were created by averaging multiple model forecasts for each valid time, which helped to reduce random errors and highlight systematic biases. The composite images showed that while both models captured the overall storm structures and temperature patterns reasonably well, they tended to overestimate the coldness, with HFSB showing a more pronounced bias than HFSA.
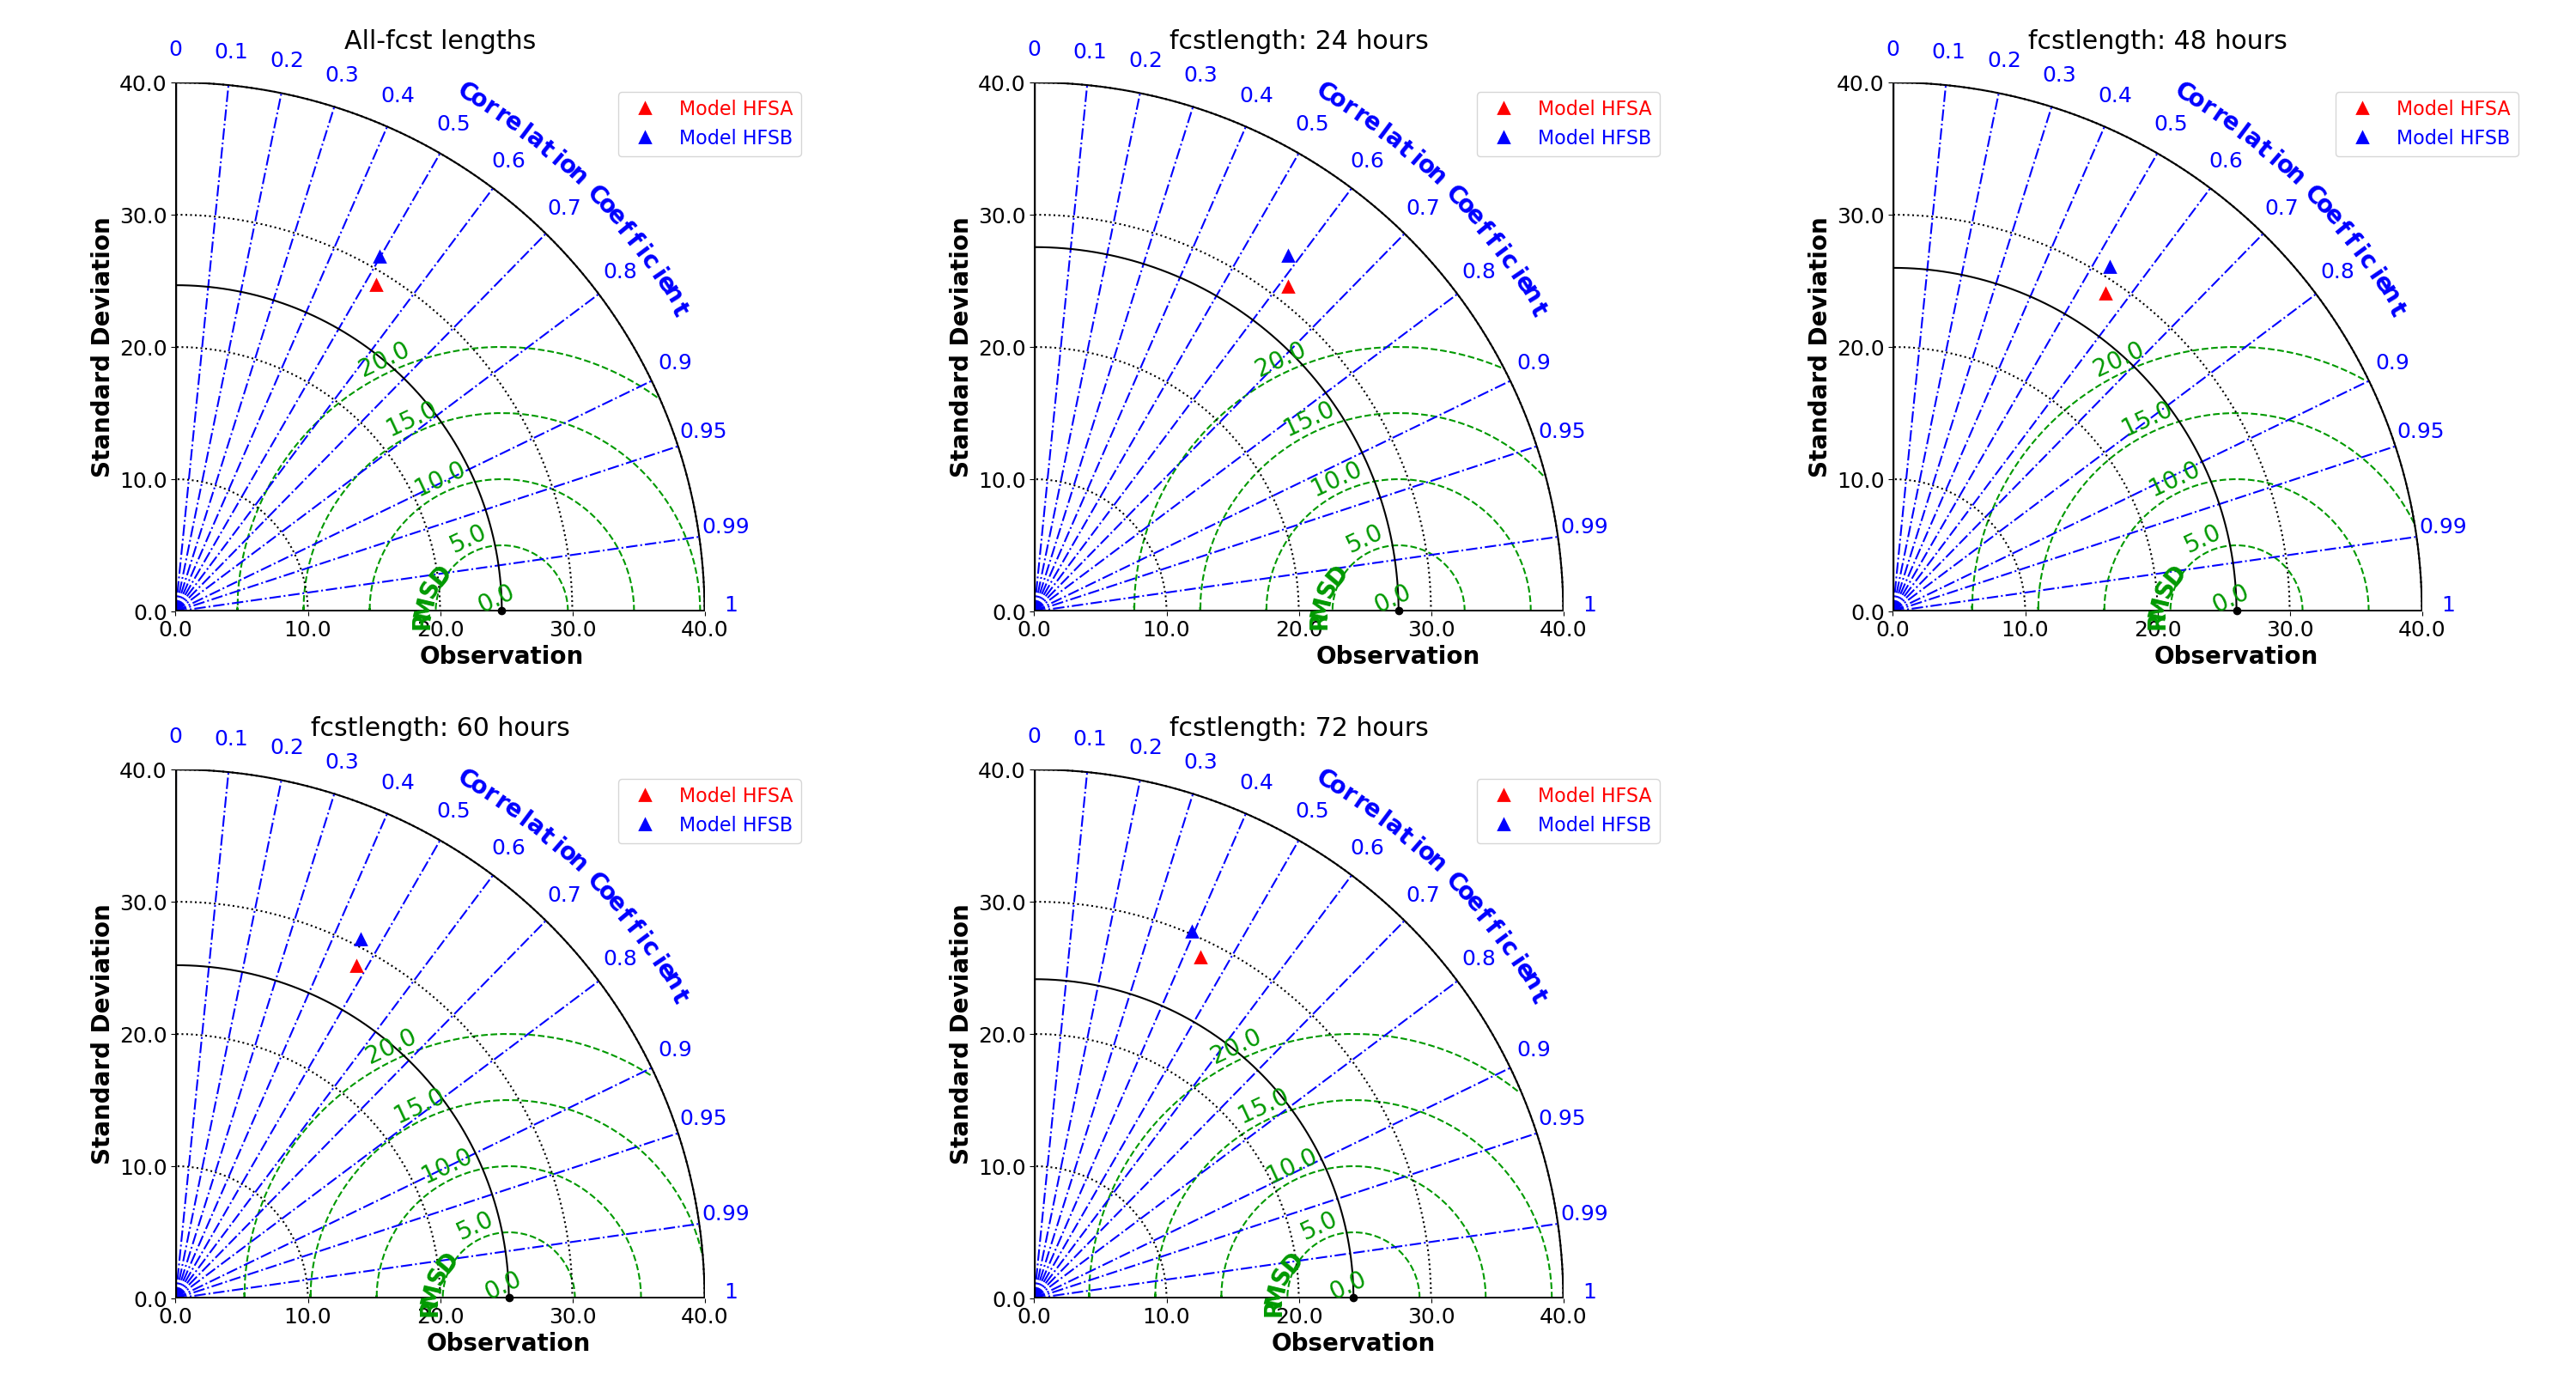
Taylor diagrams (Fig 4) and Target diagrams (not shown) were used to quantitatively assess the models' performance by comparing their outputs with the reference data using various statistical metrics, such as bias, root-mean-square difference, correlation coefficient, and standard deviation. These diagrams consistently showed that HFSA outperforms HFSB in terms of accuracy and lower error across all the hurricanes and forecast lengths.
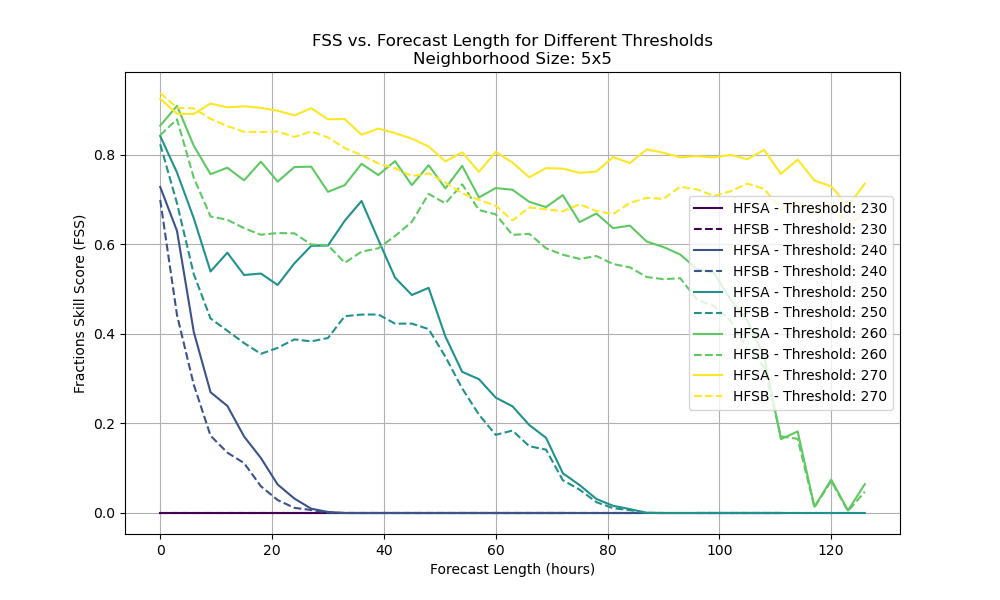
The Fractions Skill Score (FSS) analysis was particularly useful in evaluating the models' ability to capture the spatial distribution of forecasted events. The FSS compares the forecast and observed fractional coverages of an event within successively larger spatial scales, addressing the "double penalty" issue often encountered in high-resolution forecast verification. The FSS analysis demonstrated HFSA's superiority over HFSB, especially at higher thresholds and longer forecast periods, indicating its better long-term reliability and accuracy (Fig. 5).
In conclusion, both HFSA and HFSB successfully captured the overall vortex structures of the three hurricanes, including the location and asymmetry of the vortex and cold cloud tops. This analysis indicates that the models are capable of simulating the general structure and evolution of tropical cyclones. However, both models overestimated the extent and intensity of cold brightness temperatures, suggesting an overestimation of high, cold clouds, and hydrometeors. This bias was more pronounced in HFSB when compared to HFSA, implying that the differences in their microphysics schemes play a crucial role in their performance.
Infrared brightness temperature is a key indicator of cloud-top height and the presence of hydrometeors, such as cloud droplets, ice crystals, and precipitation particles. Colder brightness temperatures generally correspond to higher cloud tops and a greater concentration of hydrometeors. As the evaluation results show that both HFSA and HFSB overestimate the coldness of brightness temperatures, it suggests that the models may be overestimating the height and concentration of clouds and hydrometeors. This, in turn, could lead to errors of forecast in precipitation. The insights gained from this evaluation provide valuable guidance for improving the microphysics schemes in the HAFS configurations, which can ultimately enhance their precipitation forecasting skills. Future work should focus on diagnosing the specific processes within the microphysics schemes that contribute to these biases, such as the representation of cloud formation, ice nucleation, and precipitation processes.
This study was supported by the Developmental Testbed Center (DTC) Visitor Program. The DTC plays a crucial role in facilitating the transition of research advances into operational weather forecasting, and their support has been instrumental in enabling this evaluation of the HAFS configurations. The collaboration between the research team and the DTC has fostered a productive environment for advancing our understanding of tropical cyclone forecasting and identifying areas for improvement in the HAFS model.