Transitions Newsletter Header

Issue 37 | Spring 2024

Lead Story

Atmospheric rivers (ARs) and the Water in the West Project

Contributed by Lingyan Xin (OAR/WPO), Robert Webb (OAR/PSL), Jennifer Mahoney (OAR/GSL), Ray Tanabe (OAR/WPO, acting; otherwise NWS/PR), David Novak (NWS/WPC), John Ten Hoeve (OAR/WPO), Ligia Bernardet (OAR/GSL), Lisa Bengtsson (OAR/PSL), and Jessie Carman (OAR/WPO).

Atmospheric Rivers (ARs) are large streams of atmospheric moisture that form over the ocean and flow to the coast.  Complex air-sea and land-atmosphere interactions associated with land-falling ARs cause heavy rainfall and flooding, among other harmful consequences across the western U. S. states and further inland. Across the 11 western states, damages average approximately $1B per year with cumulative impacts of ARs for the recent 2022-2023 winter estimated at $4.6B.

Emerging needs for water resource management and emergency preparedness for high-impact AR events require increased fidelity of forecast models. The Water in the West project aims to address the critical needs of emergency planners, water resource managers and other stakeholders for:

1) Reduced errors in the forecasted landfall position of ARs
2) Improved accuracy of QPF associated with land-falling ARs
3) Reduced errors in the model intensity of land-falling ARs
4) Reduced forecast errors in snow level for land-falling ARs
5) Improved snow-accumulation forecasts

To improve AR forecasts, we need to accurately capture the detailed and interconnected physical processes occurring in the atmosphere, in the ocean, and over land.

Through FY23 and FY24 dedicated Water in the West appropriations, NOAA is undertaking a project focused on improving AR forecasts and reducing related flood damage. To improve AR forecasts, we need to accurately capture the detailed and interconnected physical processes occurring in the atmosphere, in the ocean, and over land. These processes include winds and moisture transport, formation of clouds, rain, snow, and precipitation over the mountainous terrain along the west coast of North America. At the same time, the timing and placement of the synoptic-scale steering flow largely influences where and when most of the moisture is distributed to the western portion of the Contiguous United States (CONUS) west coast.  For this purpose, we configured the Unified Forecast System (UFS) to run 13-km global simulations with a 3-km regional nest over the eastern Pacific Ocean and the western CONUS, interacting in a two-way coupling over the nested domain. This UFS-AR nested-grid approach allows for more detailed and localized weather predictions within the area covered by the high-resolution nest, while also predicting the global synoptic-scale flow at longer forecast lead times without the implications associated with providing lateral boundary conditions for a standalone regional domain.  The multiple efforts for this complex project are coordinated through a partnership among NOAA’s Physical Sciences Laboratory (PSL), Global Systems Laboratory (GSL), Environmental Modeling Center (EMC), Hydrometeorology Testbed, and the Earth Prediction Innovation Center (EPIC).

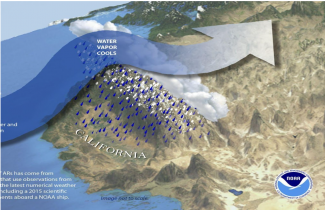
Graphic depicting atmospheric river flow (image courtesy of NOAA)

To achieve the best possible initial conditions for its model forecasts, NOAA uses a process referred to as data assimilation (DA) to generate a refined starting point to the model based on a variety of data sources, including satellite observations, weather stations, radiosondes, aircraft measurements, weather buoys, etc.  Cycling refers to a process where the model is run for a short time to produce an initial forecast, data are collected to compare with the forecast and DA techniques are employed to mathematically combine the two to provide a refined starting point for the model. This routine is done on a regular basis as part of NOAA’s operational weather forecasts.

The Water in the West project aims to run a DA system with 80 ensemble members in a cycled manner to achieve its goal of accurately predicting AR events. Running 80 ensemble members with DA is both complex and computationally expensive. The workflow that will run this system is the next step in development for the project. NOAA plans to incorporate Artificial Intelligence/Machine Learning (AI/ML) first into the computationally expensive DA system, and later to experiment with AI/ML for the similarly expensive prediction model.

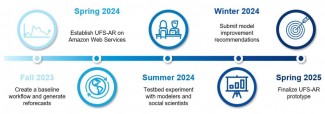
The participating organizations for the AR project are Oceanic and Atmospheric Research (OAR), National Weather Service (NWS), National Environmental Satellite, Data, and Information Service (NESDIS) of NOAA and the Center For Western Weather and Water Extremes (CW3E) of University of California, San Diego. The timeline of the implementation of the AR project is shown below.  More information on this project can be found in a recent EPIC news article.

Timeline for Implementation of the AR project


Director's Corner

Testing and Evaluation in the Machine-Learning Weather-Prediction Era

Contributed by Clark Evans NOAA GSL (formerly, Professor of Atmospheric Sciences and the Chair of the Atmospheric Sciences Program in the UWM School of Freshwater Sciences)

Can data-driven weather prediction models, in which artificial-intelligence methods are used to train algorithms for predicting specific weather elements to a desired lead time, be competitive with state-of-the-art dynamical-core and parameterized-physics numerical weather prediction models? Thanks to recent rapid advances in the field of data-driven weather prediction, what was a pipe dream just a few years ago now seems inevitable, particularly on the synoptic scale.

Currently available data-driven weather-prediction models include Google’s GraphCast, NVIDIA’s FourCastNet, Huawei’s Pangu-Weather, Microsoft’s Aurora, Fudan University’s FuXi, and ECMWF’s AIFS deterministic models, as well as Google’s GenCast probabilistic model. Google’s NeuralGCM is a hybrid model that fuses a traditional dynamical core with an artificial-intelligence module for representing physical-process tendencies, and the testing and evaluation of artificial-intelligence emulators for existing physical parameterizations (such as the Rapid Radiative Transfer Model, through CIRA and NOAA GSL) is ongoing. Though the extent to which these models have been evaluated remains extremely limited, they have demonstrated synoptic-scale forecast skill that is comparable to, or exceeds, that of the current standard bearers, ECMWF’s IFS deterministic and EPS probabilistic forecast systems. Data-driven models also appear to be capable of faithfully mimicking fundamental atmospheric physics and dynamics, learning such characteristics solely from training data.

While data-driven models are currently at low readiness levels and thus are not yet ready for operational use, their viability is actively being evaluated by operational forecast agencies. For example, ECMWF has developed its own data-driven model, the Artificial Intelligence/Integrated Forecast System (AIFS), which it is evaluating alongside four other data-driven models (ForeCastNet, FuXi, GraphCast, and Pangu-Weather). In addition, NCEP is evaluating a version of GraphCast initialized using GDAS data, and NOAA recently hosted a workshop to establish a vision for data-driven numerical weather prediction.

Given their robust performance, data-driven models will play an integral role in the present and future of numerical weather prediction.

Given their robust performance, demonstrated ability to mimic synoptic-scale kinematic and thermodynamic properties, and ongoing rapid development, data-driven models will play an integral role in the present and future of numerical weather prediction. Given that, it is fair to ask: how will and how should data-driven models be tested and evaluated? The DTC’s Science Advisory Board began to broach these questions at its Fall 2023 meeting, and given continued advances in data-driven modeling since then, these questions are even more timely now. While I don’t claim to have the answers to these important questions, I would like to share a little about what I see are the current similarities and differences in testing and evaluating these models.

Testing innovations for traditional numerical weather prediction models typically involves making one or more code changes to attempt to address a known deficiency, then running a series of increasingly complex tests (e.g., physics simulator to single-column model to two- and then fully three-dimensional models) to assess whether the changes are having the desired effect. Doing so requires a modest computational expense that is tractable for many individual researchers and research groups. This process also holds for hybrid dynamical/data-driven models, in which the specific artificial-intelligence emulators are trained separately from the rest of the model, and represents a potential new capacity for the DTC’s Common Community Physics Package. 

Testing fully data-driven models is quite different. Even as these models are informed by many architectural and hyperparameter choices, testing changes to these attributes currently requires retraining the entire model, which carries a significant computational expense (many dedicated graphics and/or tensor processing units for several days or weeks) that is not presently tractable for most researchers. Thus, until these computational resources – ideally complemented by community frameworks for developing, testing, and evaluating data-driven models at scale – become more widely available, testing innovations to data-driven models may primarily be the domain of well-resourced teams. In the interim, testing efforts may emphasize tuning pretrained models for specific prediction tasks, which typically carries less computational expense.

There may be fewer changes in how models are evaluated, however. Evaluating traditional numerical weather prediction models typically involves process-oriented diagnoses and forecast-verification activities to assess whether their solutions are physically realistic and quantify whether their solutions are improved relative to a suitable baseline. Yet, although data-driven models are presently limited in their outputs (e.g., these models do not currently attempt to mimic physical-process tendencies and the temporal frequency of their outputs is limited by the specific prediction interval for which the models are trained), their evaluation looks much the same as for traditional models. This is exemplified by idealized evaluations of Pangu-Weather by Greg Hakim and Sanjit Masanam and a case-study evaluation for Storm Ciarán by Andrew Charlton-Perez and collaborators. 

There are two noteworthy practical differences in evaluating traditional versus data-driven weather prediction models, however. First, as data-driven models bring trivial computational expense compared to traditional models, it is far easier to generate large datasets over a wide range of cases or conditions to robustly evaluate data-driven models. It also makes case-study analyses accessible to a wider range of researchers, particularly at under-resourced institutions and in developing countries. Second, although similar metrics are currently being used to verify both types of models, parallel verification infrastructures have become established for traditional versus data-driven models. An example is given by the DTC’s METplus verification framework, which underpins several modeling centers’ verification systems, and Google’s Python-based WeatherBench 2 suite for verifying data-driven models. Whereas the range of applications is currently far greater for METplus, WeatherBench 2 facilitates fully Python-based verification workflows against cloud-based gridded analysis datasets. Consequently, I believe that the broader weather-prediction community would benefit from closer collaborations between the traditional and data-driven weather modeling communities, such as hosting workshops, visitor projects, and informal discussions, to ensure that both communities can best learn from the other’s expertise and experiences.
Clark Evans NOAA GSL (formerly, Professor of Atmospheric Sciences and the Chair of the Atmospheric Sciences Program in the UWM School of Freshwater Sciences)


Who's Who

Gopa Padmanabhan

Gopakumar Padmanabhan (Gopa) is a software engineer on the GSL Verification team. His primary role is team lead for the group that evaluates and migrates to the next-generation database platforms.  Gopa previously served GSL in the role of architect developing solar X-ray-image (SXI) displays and related software.

Before joining the GSL verification team, Gopa worked at NOAA’s Space Weather Prediction Center as a software architect, for IBM and Informix as team lead, and Burmair Research as software architect.

Gopa hails from Kerala, a state located in the southwest corner of India. He did his undergraduate studies in Mechanical Engineering from National Institute of Technology, Calicut, India.  He started his career with the Indian Space Research Organization, primarily focused on the design and development of its polar satellite launch vehicle (PSLV).  He then did a short stint in Bahrain with Intergraph Corporation before moving to the USA and joining the IBM database development group. While working at IBM, he earned his Masters in Computer Science from the  University of Denver.

Academically, Gopa’s favorite subject is physics and he loves to mentor high school and undergrad level students in physics-related studies.  He also has a keen interest in eastern philosophy and this, along with a life-changing journey to the Himalayas while he was in India, inspired him to convert to being a vegetarian.

A keen interest in eastern philosophy and a a life-changing journey to the Himalayas inspired him to become a vegetarian.

Gopa lives in Highlands Ranch, CO, with his wife and two sons.  His elder son did his undergraduate studies in Aerospace Engineering at CU Boulder and currently works for a software company. His younger son is just finishing his undergraduate studies in Computer Engineering at University of Washington.

Gopa has always loved the outdoors and while in India hiked a couple of Himalian peaks (not Everest, though).  So Gopa naturally fell in love with the Colorado outdoors and loves to organize and hike Colorado’s 14-ers.  He has summited Longs Peak, La Plata, Elbert and a few others and is looking forward to adding more to his portfolio.

Gopa hiking Machu Picchu

Gopa’s other hobbies are woodworking and motorcycling.  His cars have never had the luxury of being inside his garage, since that space is taken up by tools and motorcycles. He feels that Colorado is such an awesome place to be, and every year he loves being here more and more.  Working for NOAA in weather research ties in with Gopa’s interests on many levels, his love for nature, his interest in science and many others. 

Gopa's garage and his toys


Bridges to Operations

Application of the Common Community Physics Package (CCPP) to the UFS-AQM Online System-based AQMv7 Implementation

Contributed by Jianping Huang, Fanglin Yang, and Ivanka Stajner (NOAA)

The Environmental Modeling Center (EMC) at the National Centers for Environmental Prediction (NCEP), in collaboration with the Air Resource Laboratory (ARL) and the Global Systems Laboratory (GSL), Physical Sciences Laboratory (PSL) and Chemical Sciences Laboratory (CSL) under NOAA’s Oceanic and Atmospheric Research (OAR), developed an advanced regional air-quality modeling system (AQM) within the framework of the Unified Forecast System (UFS) to enhance fire-emissions representation and improve air-quality predictions. This project received funding from the Fiscal Year 2019 Disaster Supplement Program, the Disaster Relief Supplemental Appropriations Act 2022, and the Science and Technology Integration (STI) National Air Quality Forecasting Capability (NAQFC) program.

The UFS-AQM online system integrates the UFS latest atmospheric model, which utilizes the Finite-Volume Cubed-Sphere Dynamical Core (FV3) and the Common Community Physics Package (CCPP), with the embedded U.S. Environmental Protection Agency (EPA) Community Multiscale Air Quality Model (CMAQ), which is treated as a column chemistry model. Fire emissions of gasses and particulates are provided by National Environmental Satellite, Data , and Information Service (NESDIS) using Regional Hourly Advanced Baseline Imager (ABI) and Visible Infrared Imaging Radiometer Suite (VIIRS) Emissions (RAVE) fire products.

On May 14, 2024, NCEP implemented the UFS-AQM online system as an operational model (AQMv7), replacing the previous operational model (AQMv6) based on the Global Forecast System (GFS)-CMAQ offline system. The AQMv7 implementation includes  the GFS version 16 (v16) physics package for physical parameterizations such as radiation, microphysics, boundary-layer turbulence, and land-surface processes. The GFSv16 physics package was originally developed under the Interoperable Physics Drive (IPD) framework for GFSv16 operational implementation in 2021. It has since been ported to the CCPP framework to support UFS-based applications.  

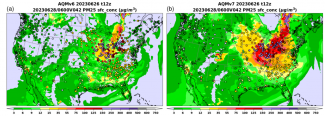
The UFS/AQM-based AQMv7 provides more accurate numerical forecast guidance for surface ozone (O3) and particulate matter with diameters less than or equal to 2.5 micrometers (PM2.5), helping to alert vulnerable populations to avoid exposure to highly polluted air.  For instance, AQMv7 predicted more realistic PM2.5 concentrations compared to AQMv6 and AirNow observations during the Quebec wildfire events in late June 2023 (Figure 1).

Figure 1. A comparison of hourly-averaged PM2.5 predictions between a) AQMv6 (GFS-driven CMAQ offline system) and b) AQMv7 (UFS-AQM online system) along with AirNow observations over the CONUS at 06:00 UTC on June 28, 2023. Model runs were initialized at 12:00 UTC on June 26, 2023 (background: model predictions, circles: AirNow observations)

Additional efforts are ongoing to further improve the UFS-AQM online system's performance with the advanced CCPP at higher resolutions, addressing air-quality prediction challenges over complex terrain, coastal regions, and areas near wildfires. Assimilation of PM2.5 observations and satellite retrievals of aerosol optical depth (AOD) and nitrogen dioxide (NO2) is being developed to improve the initialization of chemical fields.

CCPP is a state-of-the-art infrastructure designed to facilitate community-wide development of atmospheric physics parameterizations, supporting their interoperability among different modeling centers, and enabling the transition of research to operations in NWP and climate modeling. The application of CCPP in the UFS-AQM online system-based AQMv7 implementation demonstrates its flexibility and utility for different UFS-based applications.


Visitors

Evaluation of the impact of different microphysics scheme on HAFS model microphysics forecasts using GOES-R infrared images

Contributed by Shaowu Bu, Associate Professor at the Coastal Carolina University's department of coastal and marine systems science

The National Oceanic and Atmospheric Administration (NOAA) has developed a new Hurricane Analysis and Forecast System (HAFS) to improve tropical cyclone prediction. Two configurations of HAFS, HAFSv1a (HFSA) and HAFSv1b (HFSB), have been operational  since 2023. The main difference between these configurations is their microphysics schemes, which are expected to significantly influence their ability to predict clouds, hydrometeors and rainfall from tropical cyclones.

Predicting precipitation from tropical cyclones is a crucial skill, as flooding from extreme rainfall is a major hazard causing over a quarter of cyclone deaths. However, previous model-validation efforts have primarily focused on track and intensity forecasts rather than precipitation. This study aims to address this gap by evaluating the cloud-physics forecasting skill of the two HAFS configurations.

The study uses remote-sensing data from GOES-R satellites, which provide high-resolution infrared images of the hurricanes. These observed images are compared with synthetic satellite images generated from the model data using the Community Radiative Transfer Model (CRTM). The CRTM converts the model data, including atmospheric temperature, moisture profiles, surface properties, and hydrometeor characteristics, into synthetic satellite images that can be directly compared with the observed images.

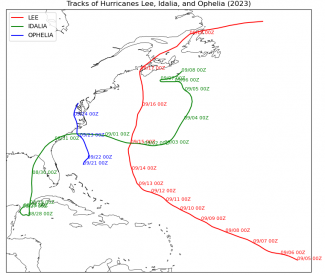
Figure 1. Tracks of the three studied storms and the evaluation durations.

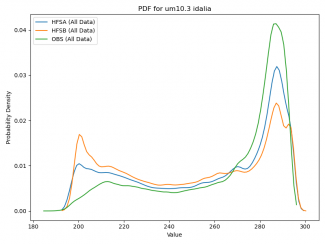
Three 2023 Atlantic hurricanes were used as case studies (Fig 1): Lee, Idalia, and Ophelia. The study employed various statistical methods to compare the model output with the observed data. Probability density functions (PDFs) were used to analyze the distribution of brightness temperatures, revealing that both HFSA and HFSB overestimate cloud coverage and the extent of cold cloud tops compared to the observed data (Fig 2).

Figure 2. PDF comparison of HFSA, HFSB and observation for storm Idalia.

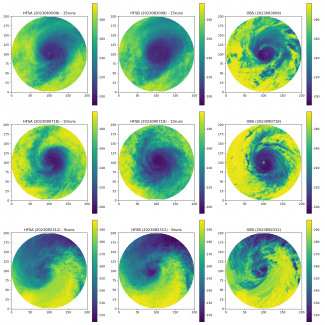
Composite images (Fig 3) were created by averaging multiple model forecasts for each valid time, which helped to reduce random errors and highlight systematic biases. The composite images showed that while both models captured the overall storm structures and temperature patterns reasonably well, they tended to overestimate the coldness, with HFSB showing a more pronounced bias than HFSA.

Figure 3. Composite infrared images of hurricanes Idalia (upper), Lee (middle), and Ophelia (lower).

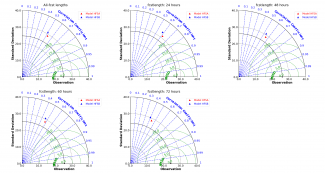
Taylor diagrams (Fig 4) and Target diagrams (not shown) were used to quantitatively assess the models' performance by comparing their outputs with the reference data using various statistical metrics, such as bias, root-mean-square difference, correlation coefficient, and standard deviation. These diagrams consistently showed that HFSA outperforms HFSB in terms of accuracy and lower error across all the hurricanes and forecast lengths.

Figure 4. Taylor diagrams for hurricane Lee at different forecast lengths. Red triangle indicates HFSA and blue HFSB.

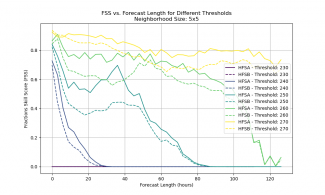
The Fractions Skill Score (FSS) analysis was particularly useful in evaluating the models' ability to capture the spatial distribution of forecasted events. The FSS compares the forecast and observed fractional coverages of an event within successively larger spatial scales, addressing the "double penalty" issue often encountered in high-resolution forecast verification. The FSS analysis demonstrated HFSA's superiority over HFSB, especially at higher thresholds and longer forecast periods, indicating its better long-term reliability and accuracy (Fig. 5).

Figure 5. Fractions skill score of HFSA and HFSB in their forecast of Hurricane Idalia.

In conclusion, both HFSA and HFSB successfully captured the overall vortex structures of the three hurricanes, including the location and asymmetry of the vortex and cold cloud tops. This analysis indicates that the models are capable of simulating the general structure and evolution of tropical cyclones. However, both models overestimated the extent and intensity of cold brightness temperatures, suggesting an overestimation of high, cold clouds, and hydrometeors. This bias was more pronounced in HFSB when compared to HFSA, implying that the differences in their microphysics schemes play a crucial role in their performance.

Infrared brightness temperature is a key indicator of cloud-top height and the presence of hydrometeors, such as cloud droplets, ice crystals, and precipitation particles. Colder brightness temperatures generally correspond to higher cloud tops and a greater concentration of hydrometeors. As the evaluation results show that both HFSA and HFSB overestimate the coldness of brightness temperatures, it suggests that the models may be overestimating the height and concentration of clouds and hydrometeors. This, in turn, could lead to errors of forecast in precipitation. The insights gained from this evaluation provide valuable guidance for improving the microphysics schemes in the HAFS configurations, which can ultimately enhance their precipitation forecasting skills. Future work should focus on diagnosing the specific processes within the microphysics schemes that contribute to these biases, such as the representation of cloud formation, ice nucleation, and precipitation processes.

This study was supported by the Developmental Testbed Center (DTC) Visitor Program. The DTC plays a crucial role in facilitating the transition of research advances into operational weather forecasting, and their support has been instrumental in enabling this evaluation of the HAFS configurations. The collaboration between the research team and the DTC has fostered a productive environment for advancing our understanding of tropical cyclone forecasting and identifying areas for improvement in the HAFS model.

Shaowu Bu


Community Connections

METplus Community Contributes Valuable Feedback For Improving Online Documentation

Contributed by John Opatz and Tara Jenson

In response to feedback from the DTC’s Science Advisory Board, a METplus focus group was formed from respondents to an email request to METplus community members. They were tasked with increasing the accessibility of METplus across its user base, with a special focus on first-time users and those who may be discovering METplus through academic avenues. Input was gathered from focus-group members via questionnaires, surveys, group discussions, and practice exercises using real-world atmospheric data. These results were then used to assess where best to enhance and improve METplus’ documentation and runtime messages.

Focus-group activities were divided into two phases. The first phase, which began on April 3rd 2023 and ran for six weeks, asked focus-group members to provide feedback based on weekly activities designed to explore one or more specific areas of METplus documentation. The results from this phase were synthesized and collated into 20 action items. These items targeted the METplus user guides for each component of the software system, as well as the METplus online tutorial and training videos. The work entailed for each action item varied, from the restructuring of the METplus online tutorial, to an informational shift from general applications to more technical aspects accompanied by better graphics, to a new MET User’s Guide top-level organizational approach for expediting how quickly users find the information they are looking for.  The METplus team worked on 10 of the 20 action items before proceeding to the second phase of the focus group. These 10 action items were chosen based on how strongly they were supported in the questionnaire responses, as well as their feasibility given the timeframe between phases.

Given the user-defined priority list, the METplus team was able to focus on action items ranked higher on the list, thus optimizing the enhancement time.

The second phase, which began on September 6th 2023, convened a subset of the same focus-group members who reviewed the improvements and updates made to address the 10 selected action items.  This approach enabled the feedback to be more targeted and gathered over a shorter time period.  Phase two results led to two significant findings.  The first was a priority list for the 20 action items created by asking each focus member to identify top priorities and combining these individual rankings into an overall combined ranking.  Given the user-defined priority list, the METplus team was able to focus initial work on those action items ranked higher on the list, thus optimizing the enhancement time.  The second finding was the significance of a focus group in which the users could participate.  Questionnaire responses indicated that users felt the development of METplus documentation through the targeted focus group was highly beneficial and would be well received by the METplus community in the future.

Ultimately, several of the documentation improvements guided by the focus group input will be available in the MET User’s Guide version 12.0.0, which is expected to be released this summer.  These improvements include the simplified, rewritten self-installation instructions for using the compile_MET_all.sh script (MET’s current recommended installation method) and new additions of a Docker and Apptainer (formerly called Singularity) installation method. Improvements stemming from the valuable focus group input also extend to the current METplus online tutorial, where a new Statistics 101 tutorial and a session on preparing your programming environment have been added.


Did you know?

Upcoming Events

Looking to engage with NOAA’s Unified Forecast System?  Take a look at these workshops!

The 2nd Annual UFS Physics Workshop

July 9-12, 2024 | NOAA National Severe Storms Laboratory | Norman, Oklahoma (and hybrid)

The focus for this year’s UFS Physics Workshop will be the ongoing need for improving convection representation in the UFS. To learn more about the latest scientific advancements from the international convection parameterization research community and operational numerical prediction centers and contribute to this important discussion, register for either in-person or virtual.

Unifying Innovations in Forecasting Capabilities Workshop 2024 (UIFCW24)

July 22-26 | Jackson State University, Jackson, Mississippi (and hybrid)

UIFCW24 will focus on integrating sectors of the Weather Enterprise and fostering a community aligned with EPIC’s mission, emphasizing government research and the crucial role of community building. UIFCW24 is about engaging and uniting our efforts to advance forecasting capabilities for a more informed future. The theme for this year’s workshop is Collaborative Progress in Earth System Modeling.

  • In-person registration must be completed by Sunday, June 30, 2024