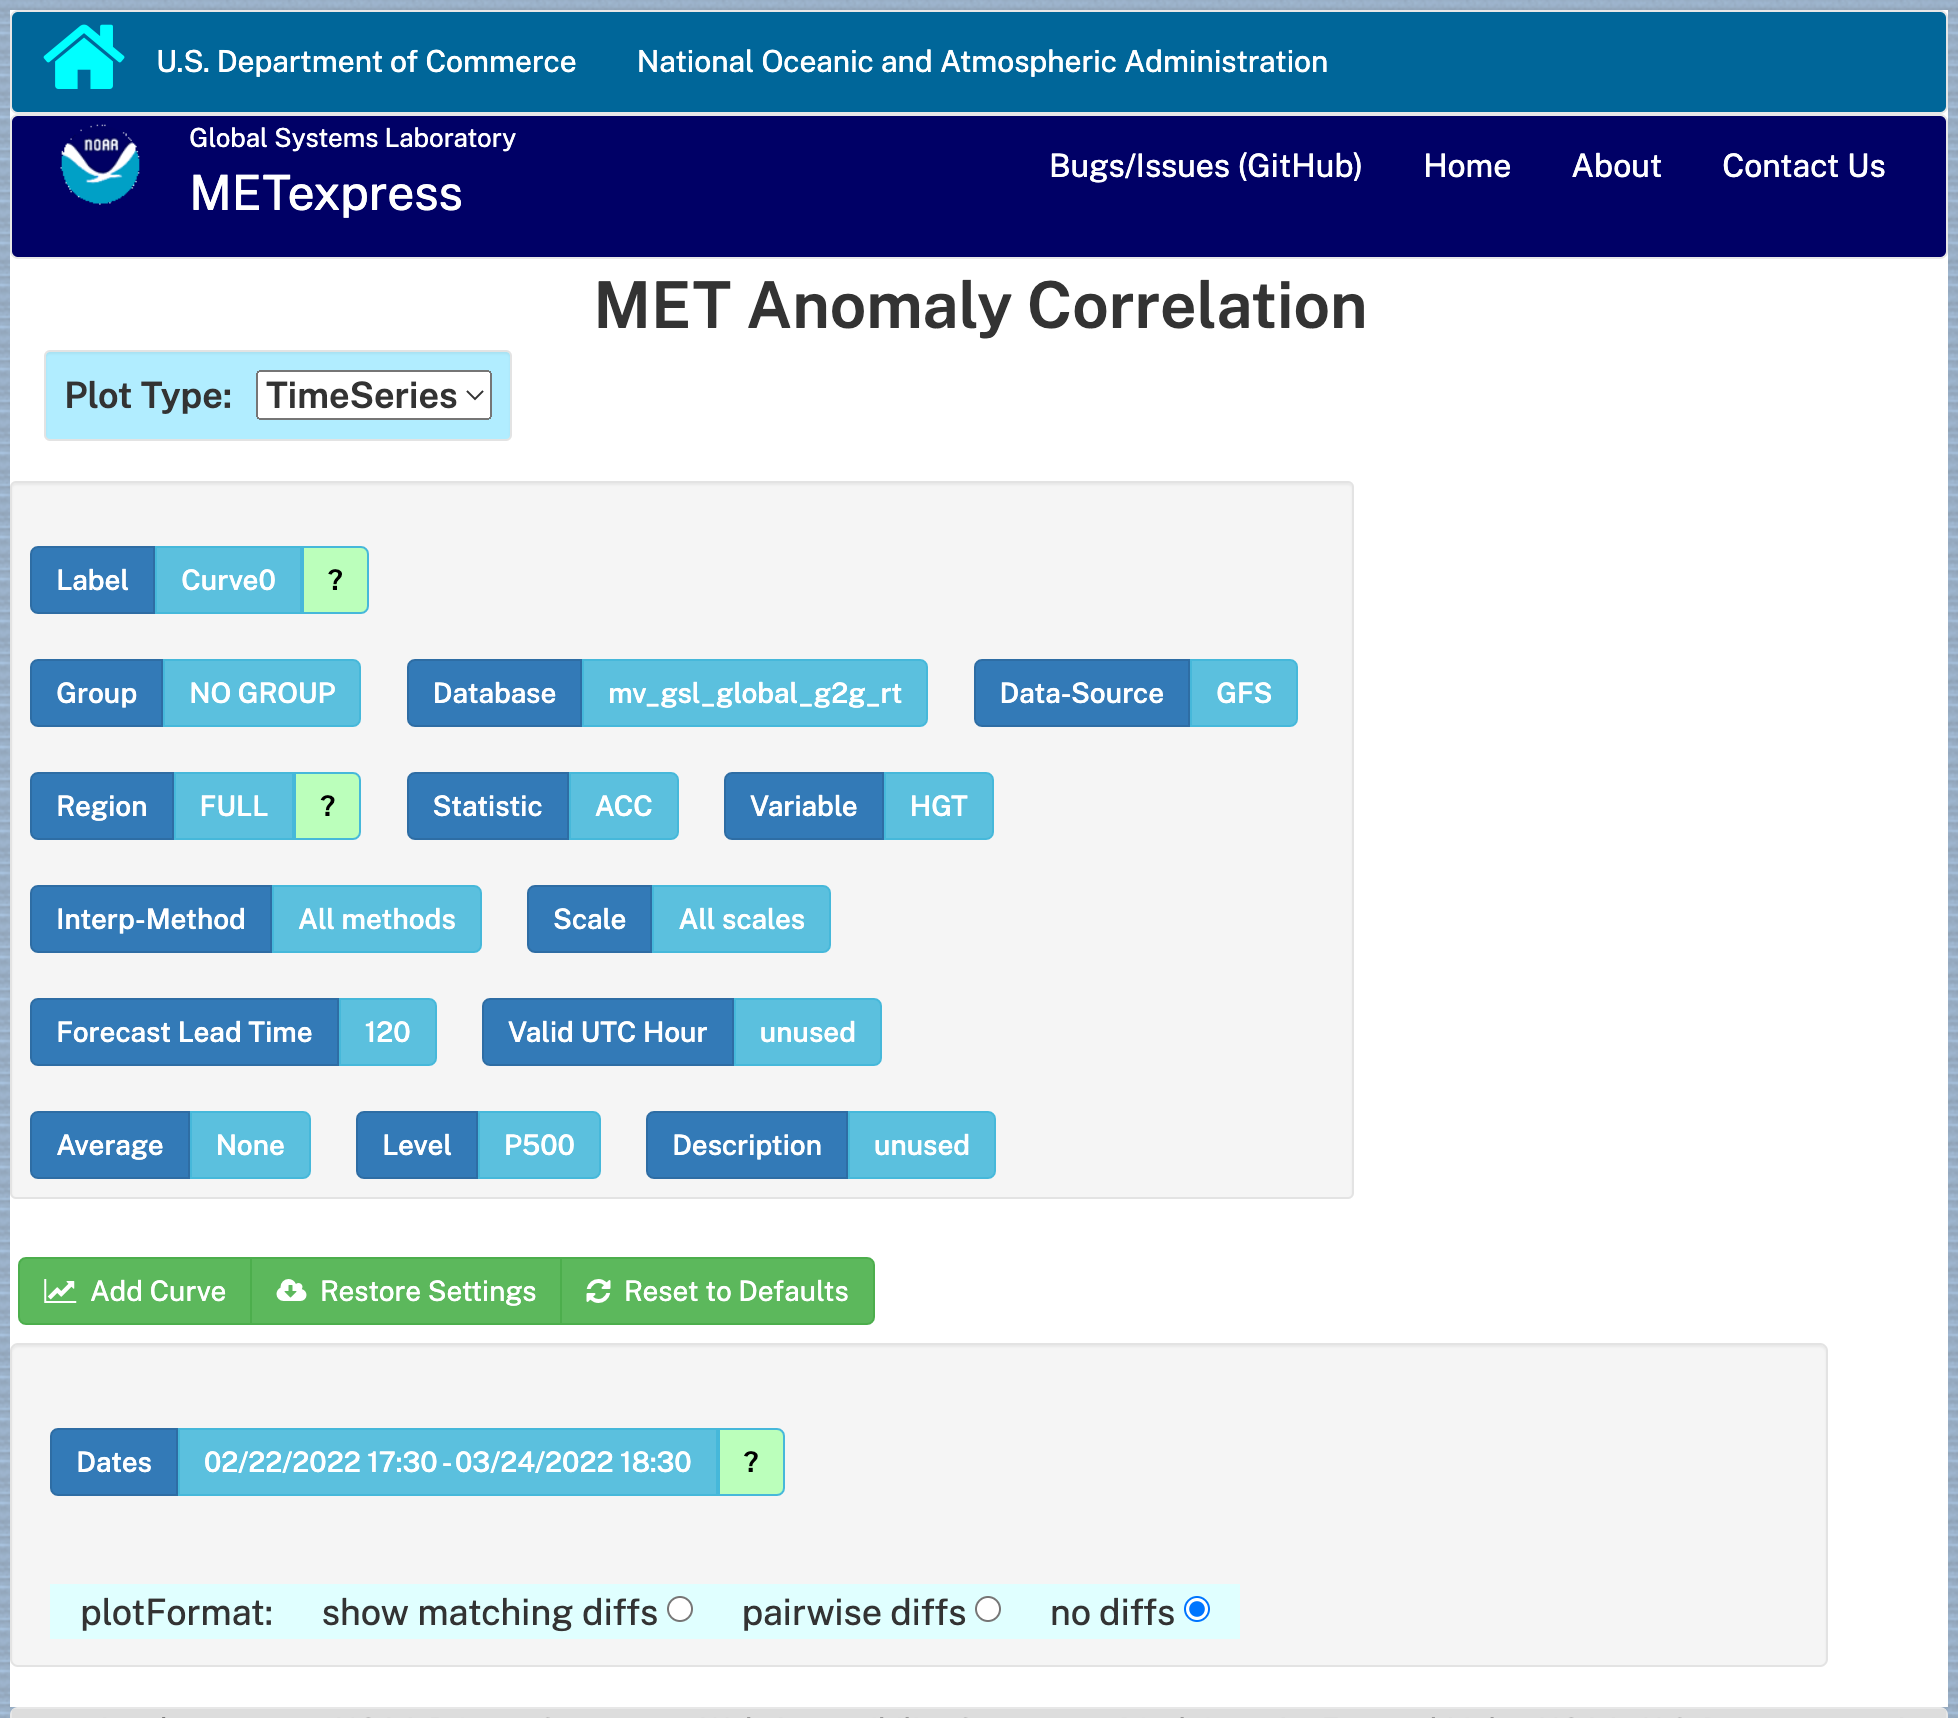
A major advancement of the Unified Forecast System Research-to-Operations (UFS-R2O) project has been the implementation of the DTC’s advanced Model Evaluation Tools (METplus) as a unified verification system for community model-development efforts. A community verification tool is important for this sort of decentralized development endeavor, as it gives all participants a common framework for evidence-based decision making when transitioning these models to operations. METplus processes numerical weather prediction output and matched “truth data” (which includes observations, analyses, tropical cyclone tracks, etc.) into a standardized format, which is then stored in a relational or document database. As a way to retrieve and visualize this stored data, the NOAA Global Systems Laboratory (GSL) and the DTC have collaboratively developed METexpress, a lightweight, quick-start visualization suite, a component of the overall METplus package. METexpress comprises eight individual apps, each designed to verify a particular meteorological facet, and features an intuitive interface with which users can quickly produce interactive graphs of common plot types.
The applications currently included are:
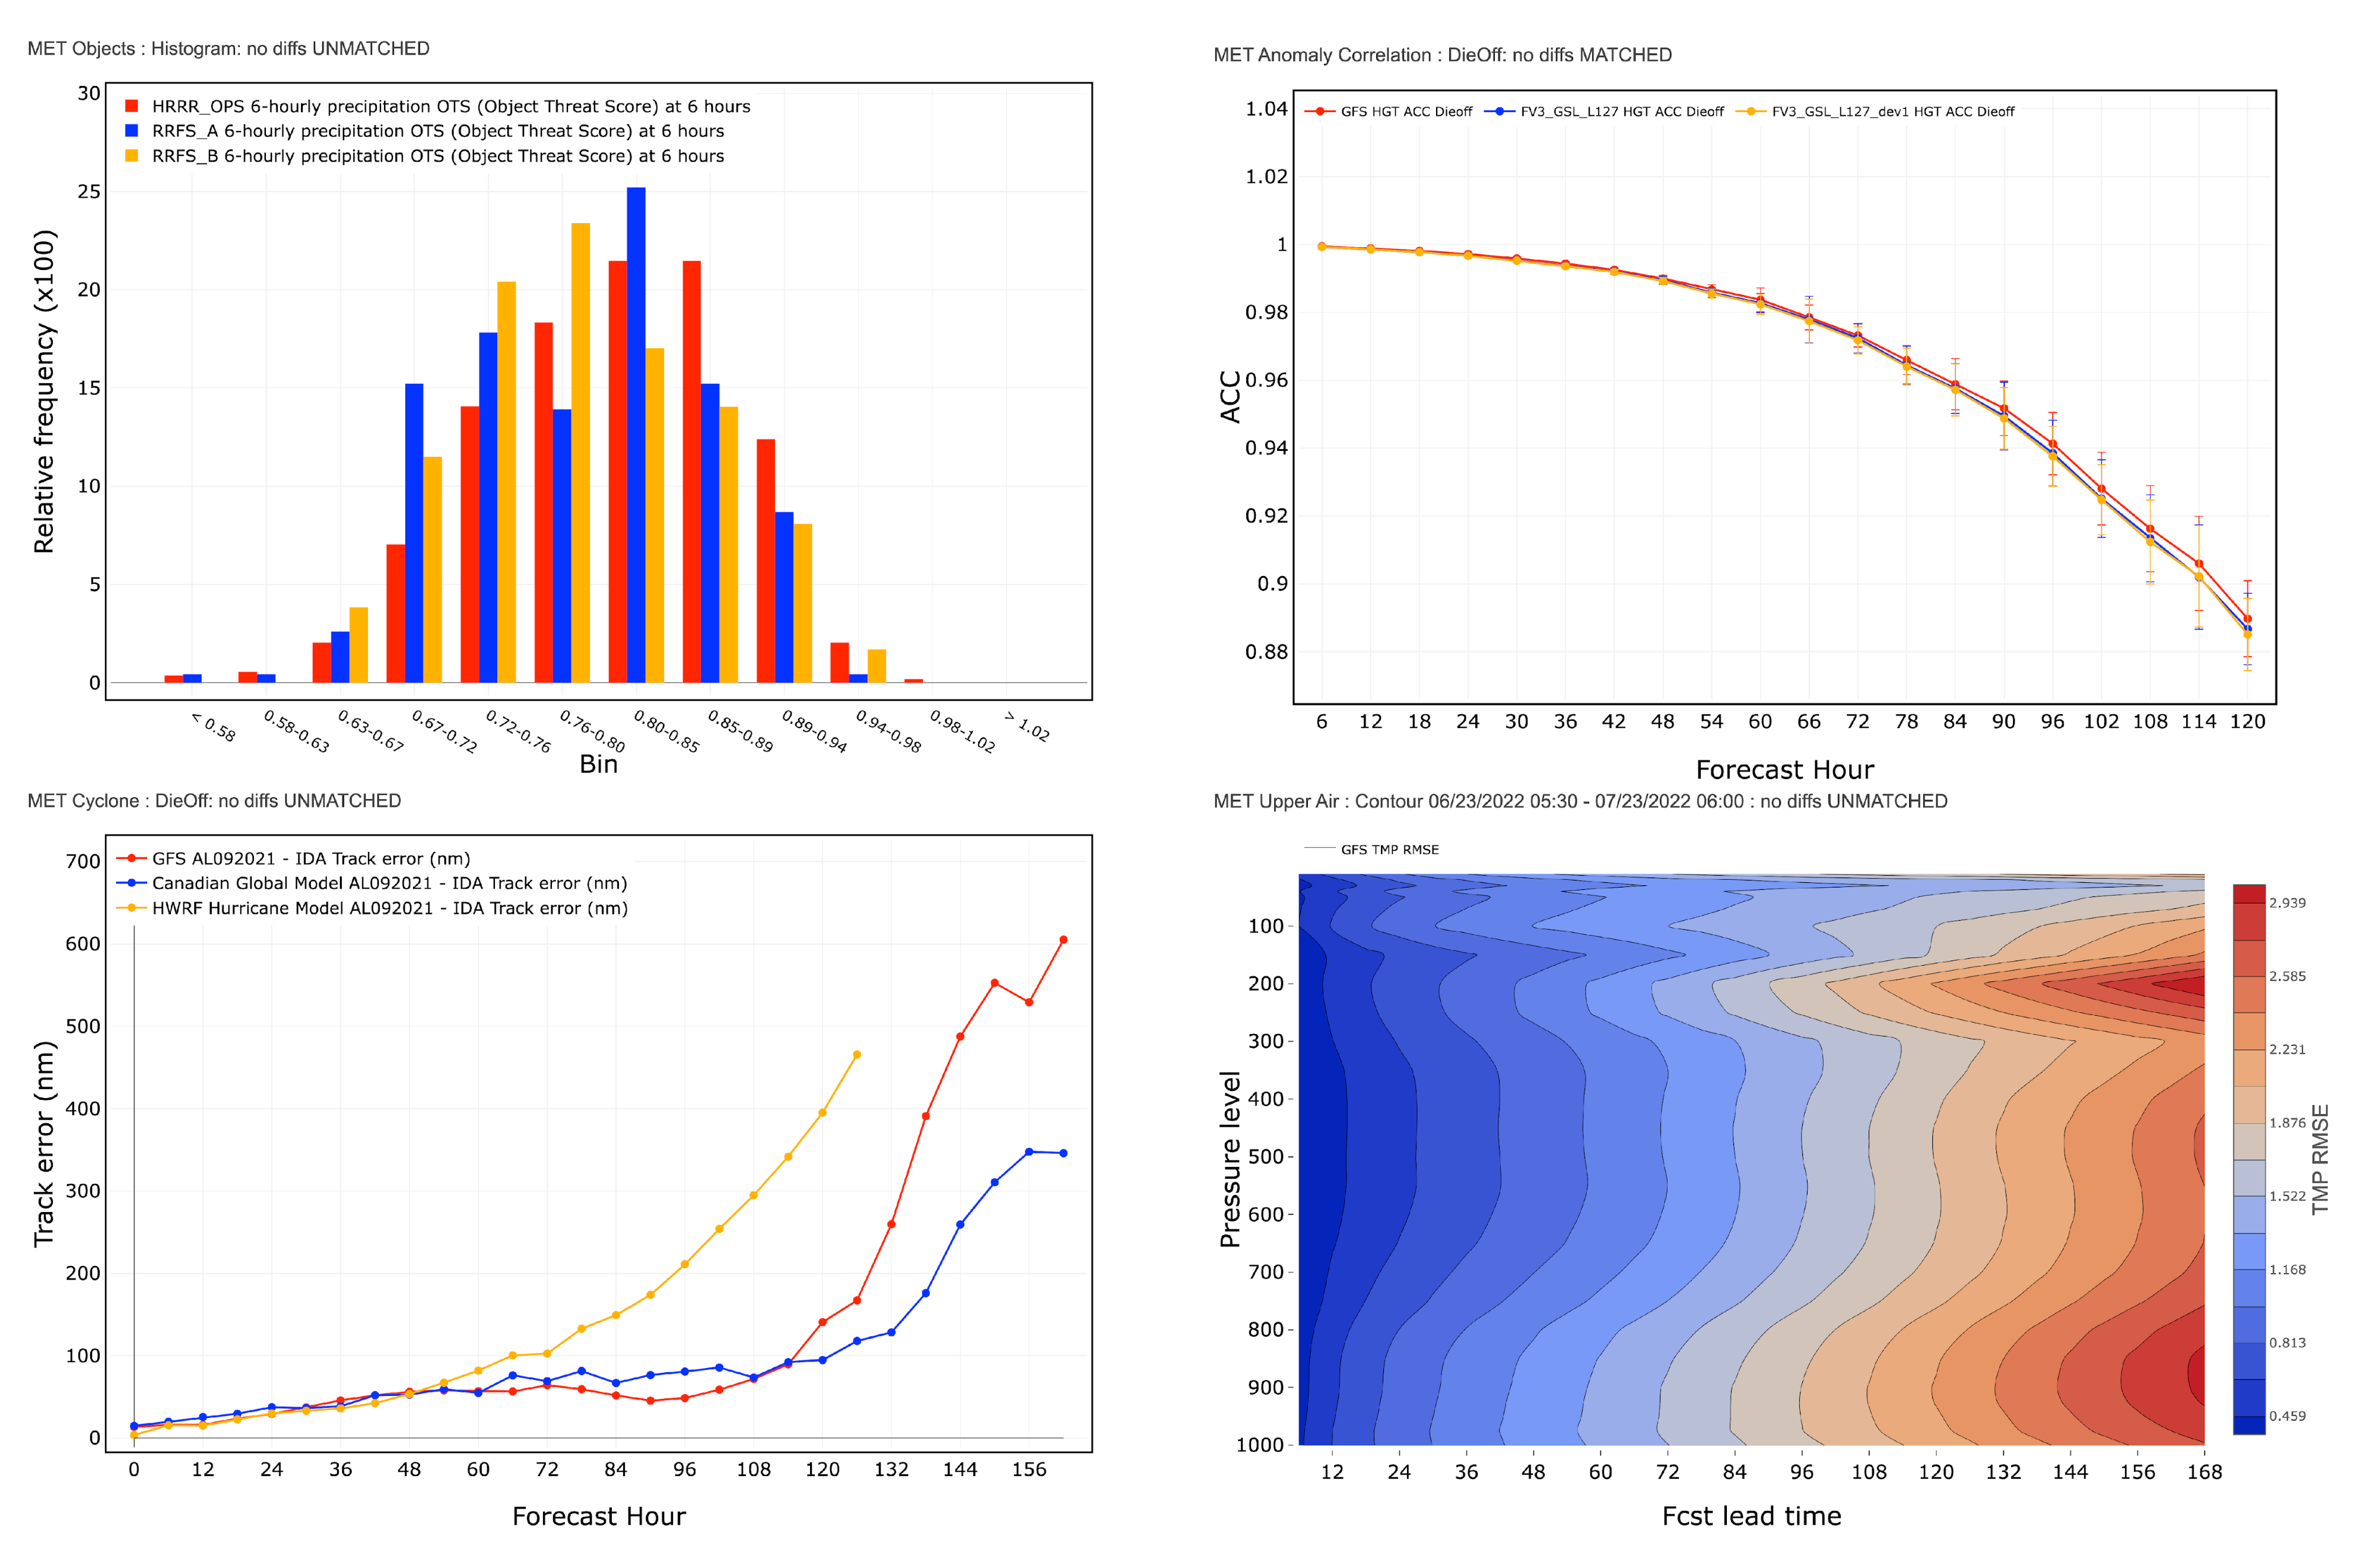
- MET Upper Air–Displays scalar and vector statistics for upper air fields on isobaric levels.
- MET Anomaly Correlation–Displays anomaly scalar and vector statistics.
- MET Surface–Displays scalar and vector statistics for surface fields on surface levels.
- MET Air Quality–Displays scalar and contingency table statistics for air quality fields on surface levels.
- MET Ensemble–Displays ensemble and probabilistic statistics for various fields.
- MET Precipitation–Displays scalar, contingency table, EV, and FSS statistics for precipitation fields.
- MET Cyclone–Displays statistics specific to tropical and extratropical cyclones. Users can examine specific ocean basins, years, and storms.
- MET Objects–Displays MODE statistics for various fields.
These applications are able to present METplus data in numerous plot types, including timeseries (time on x-axis), profile (vertical level on y-axis), dieoff (forecast lead time on x-axis), valid time (hour of the day on x-axis), threshold (threshold on x-axis), grid scale (grid scale on x-axis), year-to-year plots (yearly averaged timeseries), histogram, ensemble histogram, reliability curve, ROC diagram, performance diagram, and contour.
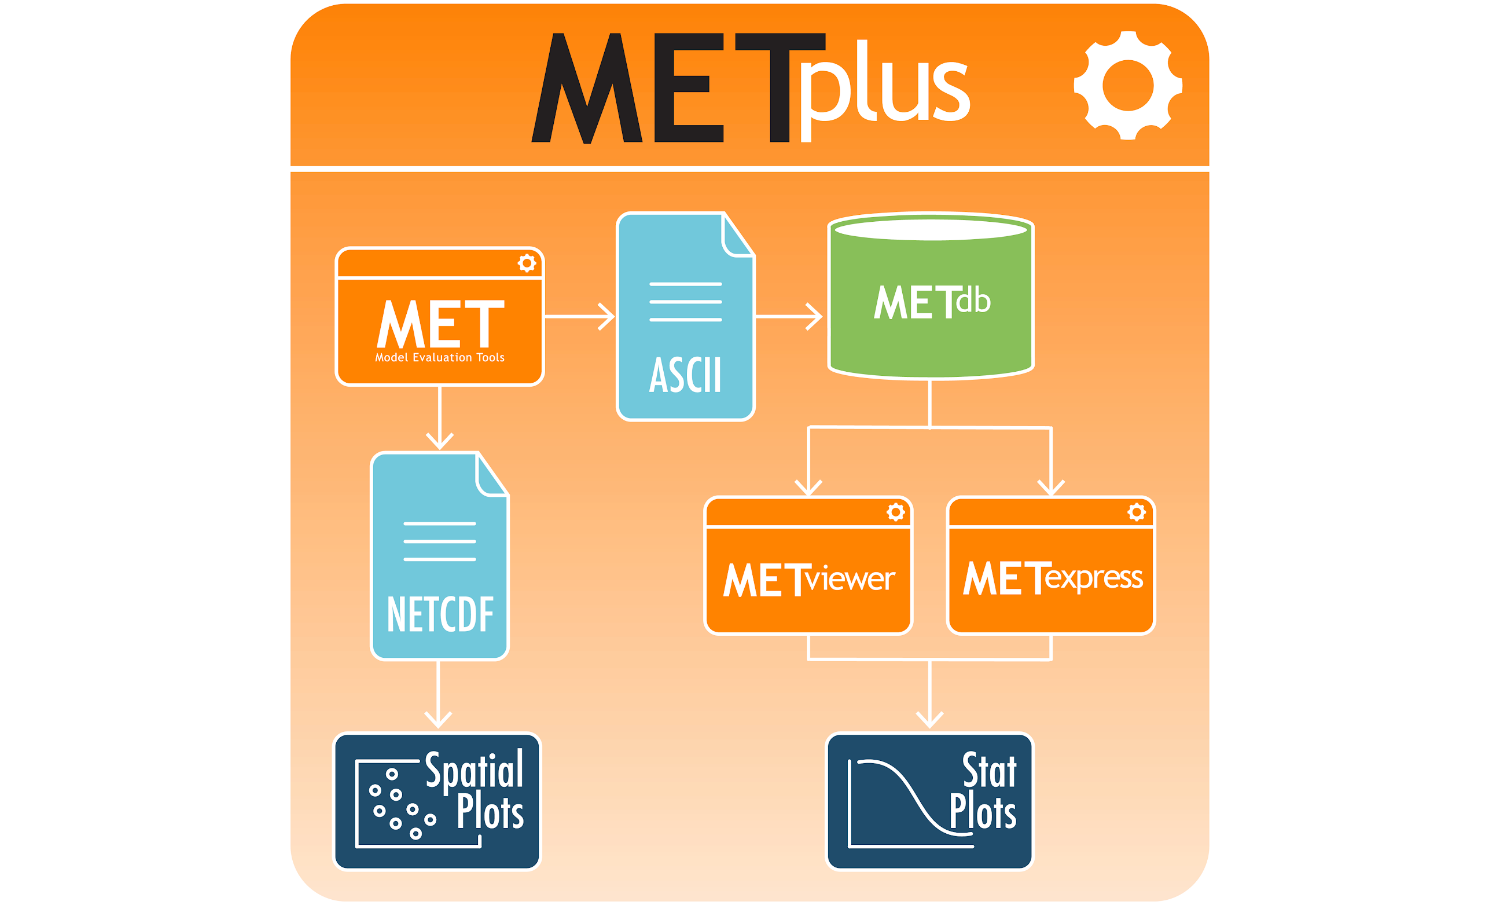
METexpress has transitioned to operations within the NWS Environmental Modeling Center (EMC) (https://metexpress.nws.noaa.gov), and with NOAA GSL’s in-house model developers (https://gsl.noaa.gov/mats). METexpress, like the rest of METplus, is open source, and our hope is that, as more features are added, its use continues to expand amongst the UFS-R2O community, and to other public- and private-sector entities, aiding the development of new, next-generation models.
For more information about METexpress, please visit https://dtcenter.org/community-code/metexpress or email mats.gsl@noaa.gov.