Model intercomparison has always come with challenges, not least of all, the decisions such as which domain and grid to compare them on and the observations to compare them against. The latter also involves the often “hidden” decision about which interpolation to use. We interpolate our data almost without thinking about it and forget just how influential that decision might be. Let’s also add the software into the mix, because, in reality we need to. In 2019 the UK Met Office made the decision to adopt METplus as the replacement for all components of verification (model development, R2O, and operational). Almost three years into the process, we know that despite the fact that we have two robust and well-reviewed software systems, the two systems do not produce the same results when fed the same forecasts and observations, yet both are correct! The reasons why this may be the case can be many and varied, from the machine architecture we run them on, the languages used (C++ and Fortran), and even whether you use GRIB or netCDF file format.
It brought to mind the World Meteorological Organisation (WMO) Commission for Basic Systems (CBS) exchange of verification scores (deterministic and ensemble) where, despite having some detailed instructions of what statistical scores to compute and how to compute them, each global modelling centre computes them using their own software. In essence the scores are comparable, but they are not as comparable as we might believe. The only way they would be comparable on all levels is if the forecasts and observations were put through the same code with all inputs processed identically. Community codes, therefore, form a vital link in model-intercomparison activities, which is a point we may not have thoroughly considered. In short, common software provides confidence in the process and the outcomes.
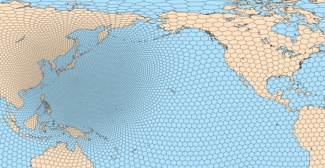
Cue the “cube-sphere revolution,” as I have come to call it. Europe, in particular, has been in the business of funky grids for a long time (thinking of Météo France’s stretched and Met Office’s variable resolution and German Weather Service’s (DWD) icosahedral grids). The next-generation Model for Prediction Across Scales (MPAS) and FV3 make use of unstructured grids (e.g. Voronoi and cube-sphere meshes, respectively) and the Met Office future dynamical core is also based on the cube-sphere. Most of these grids remove the singularity at the poles primarily to improve the scaling of codes on new HPC architectures. These non-regular grids (in the traditional sense) bring new challenges. Yes, most users don’t notice any difference because forecast products tend to be interpolated onto a regular grid before they see or interact with them. However, model developers want to assess model output and verification on the native grid because interpolation (and especially layers of) can be very misleading. For example, if the cube-sphere output is first interpolated onto a regular latitude-longitude raster coordinate system (to make it more manageable), that’s the first layer of interpolation. If these interpolated regular gridded fields are then fed into verification software such as METplus and further interpolation to observations is requested, then that’s the second layer of interpolation. In this instance, the model output has been massaged twice before it is compared to the observations. This is not verification of the raw model output anymore. However, shifting the fundamental paradigm of our visualisation and verification codes away from a structured and regular one is a challenge. It means supporting the new UGRID (Unstructured Grid) standard, which is fundamentally very different. Just as the old regular grid models are not scalable on new HPC architectures, the processing of unstructured grids doesn’t scale well with the tools we’ve used thus far (e.g. python matplotlib for visualisation). New software libraries and codes are being developed to keep pace with the changes in the modelling world.
As the models change and advance, our tools must change as well. This can’t happen without significant investment, and can be a big ask for any single institution, further underlining the importance of working together on community codes. The question is then how fast we can adapt and develop the community codes so that we can support model development in the way we need to.

