As a visitor to DTC in 2016, University of North Dakota Ph.D. candidate Mariusz Starzec investigated the performance of regional summertime convective forecasts. In particular, he focused on model skill in predicting the coverage, morphology, and intensity of convection. Further emphasis was placed on how representative the simulated internal convective structure is of observed convection by using the reflectivity field as proxy for convective processes.
Convection plays a major role in everyday weather and long term climate. Any biases present in convective forecasts have important implications on the accuracy of operational forecasts, potential severe weather hazards, and climatic feedbacks. Validation of model forecasts are required to identify if any of these biases exist.
For the DTC project, four months of forecasts from six 3-km Weather Research and Forecasting (WRF) model configurations were assessed, where one of the configuration was the High Resolution Rapid Refresh (HRRR). The WRF configurations consisted of a combination of varying microphysics and model versions. The simulated reflectivity field was compared against the radar-observed reflectivity field, which is an instantaneous snapshot into what is occurring in the convective system. More importantly, this approach allows for the entire three-dimensional vertical structure of convective systems to be evaluated.
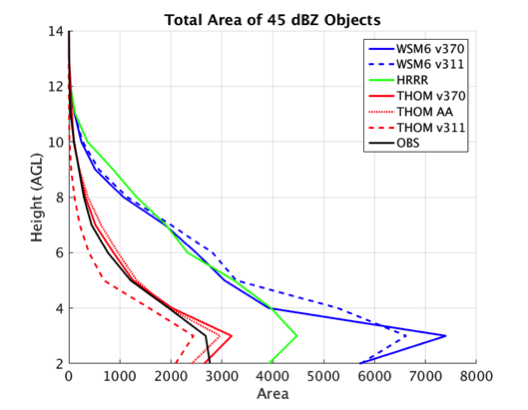
Forecasts were analyzed using an object-based approach, where bulk attributes of discrete storm cells are emphasized instead of exact timing and location. Object counts and their respective areas with height were evaluated, along with the vertical distribution of reflectivity values within these objects. Overall, convective forecasts were generally more intense, contained more and larger objects, and covered more area than observed convection. The largest over-predictions occurred during the peak in the diurnal cycle. No major differences were found between model versions, although varying the microphysics caused large differences in the vertical distributions of object counts and areas.
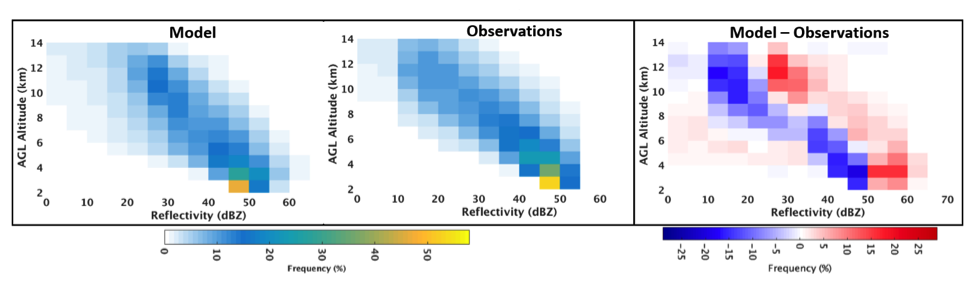
Vertical distributions of reflectivity in forecasted and observed objects showed that simulated convection has a wider distribution of reflectivity values, especially aloft (>5 km). In general, reflectivity distributions were overly intense by 5-10 dBZ and reflectivity magnitudes in the melting layer were frequently and notably over-pronounced. A further inter-comparison of the model physics and versions revealed that although minor differences can be found near the surface at 1 and 2 km, major differences in convective structure can be found aloft.
One of the findings of this project indicates that it is important to validate forecasts at multiple heights, as evaluation of model fields at one level may not reveal any biases. More research is required into three-dimensional model verification, so new verification tools and algorithms that can accomplish such tasks are needed.
Mariusz was hosted by Tara Jensen and found that traveling to NCAR and collaborating with DTC was an invaluable learning experience, and he enjoyed getting to meet everyone and learn about their research. Outside of the DTC project, he had fun exploring around Boulder and hiking as many trails as possible in both the foothills and the Rockies.