Robust testing and evaluation of research innovations is a critical component of the Research-to-Operations (R2O) process and is performed for NCEP by the Developmental Testbed Center (DTC).
At the foundation of the DTC testing and evaluation (T&E) system is the Model Evaluation Tools (MET), which is also supported to the community through the DTC. The verification team within the DTC has been working closely with DTC teams as well as the research and operational communities (e.g. NOAA HIWPP program and NCEP/EMC respectively) to enhance MET to better support both internal T&E activities and testing performed at NOAA Centers and Testbeds.
METv5.1 was released to the community in October 2015. It includes a multitude of enhancements to the already extensive capabilities. The additions can be grouped into new tools, enhanced controls over pre-existing capabilities, and new statistics. It may be fair to say there is something new for everyone.
New tools: Sometimes through the development process, user needs drive the addition of new tools. This was the case for the METv5.1 release. The concept of automated regridding within the tools was first brought up during a discussion with the Science Advisory Board. The concept was embraced as a way to make the Mesoscale Model Evaluation Testbed (MMET) more accessible to researchers and was added. The MET team took it one step further and not only added the capability to all MET tools that ingest gridded data but also developed a stand-alone tool (regrid_data_plane) to facilitate regridding, especially of NetCDF files.
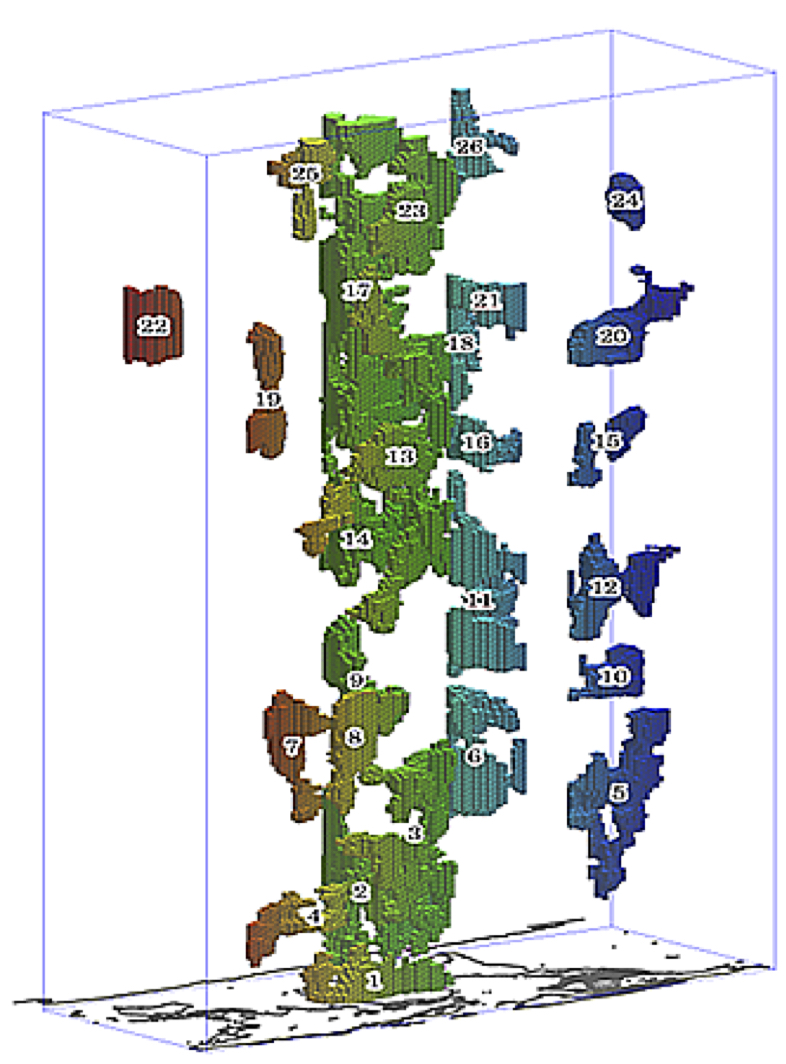
For those who use or would like to use the Method for Object-based Diagnostic Evaluation (MODE) tool in MET, a new tool (MODE-Time Domain or MTD) that tracks objects through time has been developed. In the past, many MET users have performed separate MODE runs at a series of forecast valid times and analyzed the resulting object attributes, matches and merges as functions of time in an effort to incorporate temporal information in assessments of forecast quality. MTD was developed as a way to address this need in a more systematic way. Most of the information obtained from such multiple coordinated MODE runs can be obtained more simply from MTD. As in MODE, MTD applies a convolution field and threshold to define the space-time objects. It also computes the single 3D object attributes (e.g. centroid, volume, and velocity) and paired 3D object attributes (e.g. centroid distance, volume ratio, speed difference).
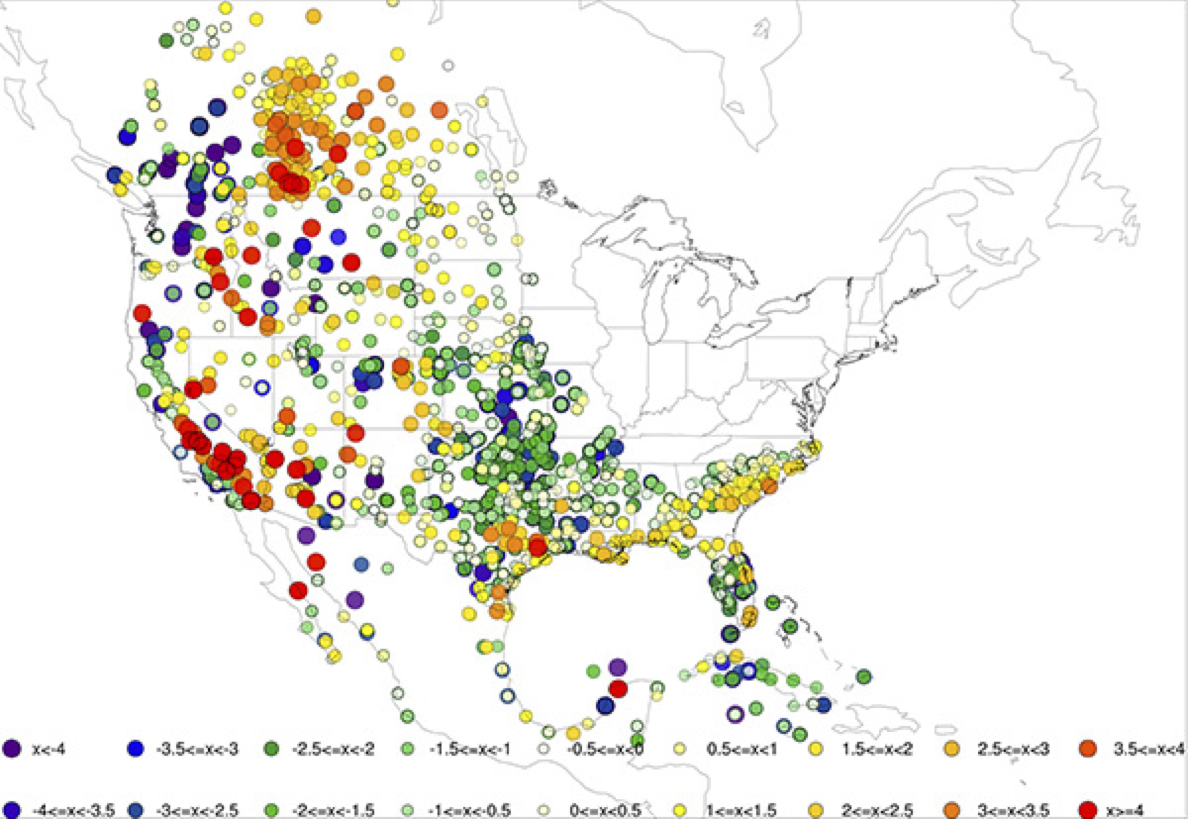
To address the needs of the Gridpoint Statistical Interpolation (GSI) Data Assimilation community tool, the DTC Data Assimilation Team and MET team worked together to develop a set of tools to read the GSI binary diagnostic files. The files contain useful information about how a single observation was used in the analysis by providing details such as the innovation (O-B), observation values, observation error, adjusted observation error, and quality control information. When MET reads GSI diagnostic files, the innovation (O-B; generated prior to the first outer loop) or analysis increment (O-A; generated after the final outer loop) is split into separate values for the observation (OBS) and the forecast (FCST), where the forecast value corresponds to the background (O-B) or analysis (O-A). This information is then written into the MET matched pair format. Traditional statistics (e.g. Bias, Root Mean Square Error) may then be calculated using the MET Stat-Analysis tool. Support for ensemble based DA methods is also included. Currently, three observation types are supported, Conventional, AMSU-A and AMSU-B.
Enhanced Controls: Working with DTC teams and end users usually provides plenty of opportunities to identify optimal ways to enhance existing tools. One example of this occurred during the METv5.1 release. Finer controls of thresholding were added to several tools to allow for more complex definitions of events used in the formulation of categorical statistics. This option is useful if a user would like to look at a particular subset of data without computing multi-categorical statistics (e.g. the skill for predicting precipitation between 25.4 mm and 76.2 mm). The thresholding may also now be applied to the computation of continuous statistics. This option is useful when assessing model skill for a sub-set of weather conditions (e.g. during freezing conditions or cloudy days as indicated by a low amount of incoming shortwave radiation).
Another example includes combining several tools such as Gen_Poly_Mask and Gen_Circle_Mask into a more generalized tool Gen_Vx_Mask. The Gen-Vx-Mask tool may be run to create a bitmap verification masking region to be used by the MET statistics tools. This tool enables the user to generate a masking region once for a domain and apply it to many cases. The ability to compute the union, intersection or symmetric difference of two masks was also added to Gen_Vx_Mask to provide finer control for a verification region. Gen_Vx_Mask now supports the following types of masking definitions:

- Polyline (poly) masking reads an input ASCII file containing Lat/Lon locations. This option is useful when defining geographic sub-regions of a domain.
- Circle (circle) masking reads an input ASCII file containing Lat/Lon locations and for each grid point, computes the minimum great-circle arc distance in kilometers to those points. This option is useful when defining areas within a certain radius of radar locations.
- Track (track) masking reads an input ASCII file containing Lat/Lon locations of a “track” and for each grid point, computes the minimum great-circle arc distance in kilometers. This option is useful when defining the area within a certain distance of a hurricane track.
- Grid (grid) masking reads an input gridded data file, extracts the field specified using the its grid definition. This option is useful when using a model nest to define the corresponding area of the parent domain.
- Data (data) masking reads an input gridded data file, extracts the field specified by some threshold. The option is useful when thresholding topography to define a mask based on elevation or when thresholding land use to extract a particular category.
Additional examples of enhanced controls include the user being able to define a rapid intensification / rapid weakening event for a tropical cyclone in a more generic way with TC-Stat. This capability was then included in the Stat-Analysis tools to allow for identification of ramp events for renewables or extreme change events for other areas of study.
New Statistics: In support of the need for expanded probabilistic verification capability of both regional and global ensembles, the MET team added a “climo_mean” specification to the Grid-Stat, Point-Stat, and Ensemble-Stat configuration files. If a climatological mean is included, the Anomaly Correlation is reported in the continuous statistics output. If a climatological or reference probability field is provided, Brier Skill Score and Continuous Ranked probability score are reported in the probabilistic score output. Additionally, the decomposition of the Mean Square Error field was also included in the continuous statistics computations. These options are particularly useful to the global NWP community and were added to address the needs of the NCEP/EMC Global Climate and Weather Prediction Branch.
In conclusion, the MET team strives to provide the NWP community with a state-of-the-art verification package. “State-of-the-art” means that MET will incorporate newly developed and advanced verification methodologies, including new methods for diagnostic and spatial verification but also will utilize and replicate the capabilities of existing systems for verification of NWP forecasts. We encourage those in the community to share your requirements, ideas, and algorithms with our team so that MET may better serve the entire verification community. Please contact us at met_help@ucar.edu.