Transitions Newsletter Header

Issue 9 | Winter 2016

Lead Story

Expanding Capability of DTC Verification

Contributed by Tara Jensen & John Halley Gotway

Robust testing and evaluation of research innovations is a critical component of the Research-to-Operations (R2O) process and is performed for NCEP by the Developmental Testbed Center (DTC).
At the foundation of the DTC testing and evaluation (T&E) system is the Model Evaluation Tools (MET), which is also supported to the community through the DTC. The verification team within the DTC has been working closely with DTC teams as well as the research and operational communities (e.g. NOAA HIWPP program and NCEP/EMC respectively) to enhance MET to better support both internal T&E activities and testing performed at NOAA Centers and Testbeds.

METv5.1 was released to the community in October 2015. It includes a multitude of enhancements to the already extensive capabilities. The additions can be grouped into new tools, enhanced controls over pre-existing capabilities, and new statistics. It may be fair to say there is something new for everyone.

New tools:  Sometimes through the development process, user needs drive the addition of new tools. This was the case for the METv5.1 release. The concept of automated regridding within the tools was first brought up during a discussion with the Science Advisory Board. The concept was embraced as a way to make the Mesoscale Model Evaluation Testbed (MMET) more accessible to researchers and was added. The MET team took it one step further and not only added the capability to all MET tools that ingest gridded data but also developed a stand-alone tool (regrid_data_plane) to facilitate regridding, especially of NetCDF files. 

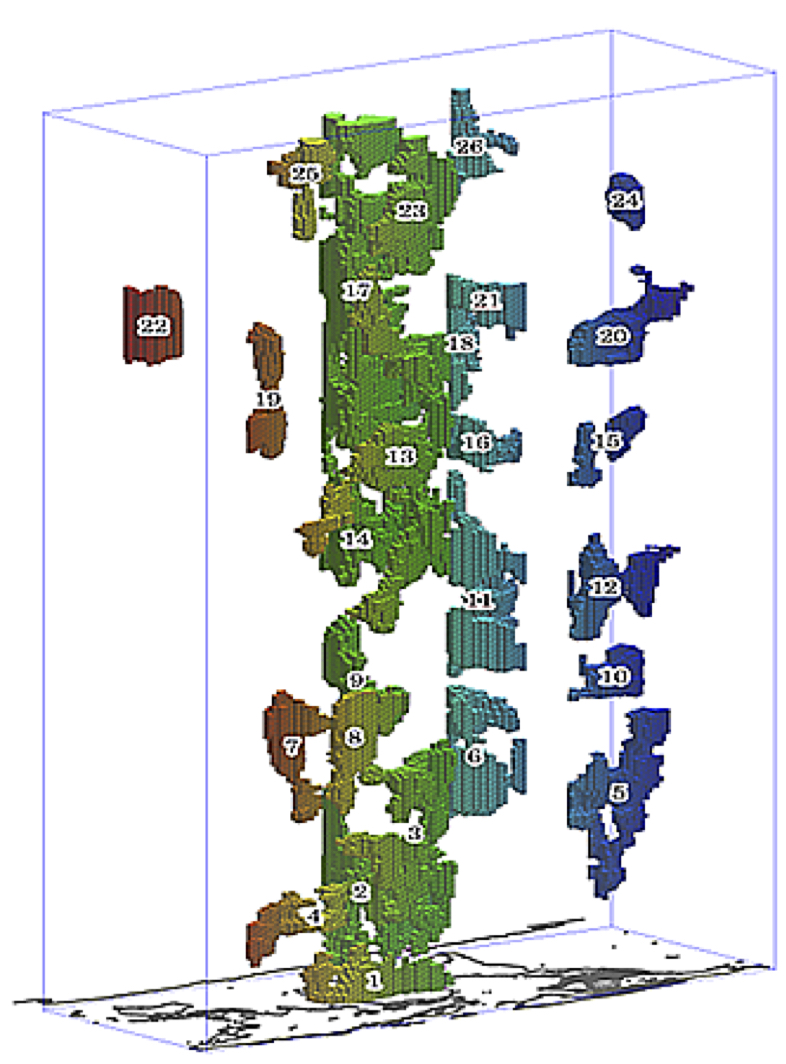
For those who use or would like to use the Method for Object-based Diagnostic Evaluation (MODE) tool in MET, a new tool (MODE-Time Domain or MTD) that tracks objects through time has been developed. In the past, many MET users have performed separate MODE runs at a series of forecast valid times and analyzed the resulting object attributes, matches and merges as functions of time in an effort to incorporate temporal information in assessments of forecast quality. MTD was developed as a way to address this need in a more systematic way. Most of the information obtained from such multiple coordinated MODE runs can be obtained more simply from MTD. As in MODE, MTD applies a convolution field and threshold to define the space-time objects. It also computes the single 3D object attributes (e.g. centroid, volume, and velocity) and paired 3D object attributes (e.g. centroid distance, volume ratio, speed difference).

To address the needs of the Gridpoint Statistical Interpolation (GSI) Data Assimilation community tool, the DTC Data Assimilation Team and MET team worked together to develop a set of tools to read the GSI binary diagnostic files. The files contain useful information about how a single observation was used in the analysis by providing details such as the innovation (O-B), observation values, observation error, adjusted observation error, and quality control information. When MET reads GSI diagnostic files, the innovation (O-B; generated prior to the first outer loop) or analysis increment (O-A; generated after the final outer loop) is split into separate values for the observation (OBS) and the forecast (FCST), where the forecast value corresponds to the background (O-B) or analysis (O-A). This information is then written into the MET matched pair format. Traditional statistics (e.g. Bias, Root Mean Square Error) may then be calculated using the MET Stat-Analysis tool. Support for ensemble based DA methods is also included. Currently, three observation types are supported, Conventional, AMSU-A and AMSU-B.

Enhanced Controls: Working with DTC teams and end users usually provides plenty of opportunities to identify optimal ways to enhance existing tools. One example of this occurred during the METv5.1 release. Finer controls of thresholding were added to several tools to allow for more complex definitions of events used in the formulation of categorical statistics. This option is useful if a user would like to look at a particular subset of data without computing multi-categorical statistics (e.g. the skill for predicting precipitation between 25.4 mm and 76.2 mm). The thresholding may also now be applied to the computation of continuous statistics. This option is useful when assessing model skill for a sub-set of weather conditions (e.g. during freezing conditions or cloudy days as indicated by a low amount of incoming shortwave radiation).

Another example includes combining several tools such as Gen_Poly_Mask and Gen_Circle_Mask into a more generalized tool Gen_Vx_Mask. The Gen-Vx-Mask tool may be run to create a bitmap verification masking region to be used by the MET statistics tools. This tool enables the user to generate a masking region once for a domain and apply it to many cases. The ability to compute the union, intersection or symmetric difference of two masks was also added to Gen_Vx_Mask to provide finer control  for a verification region. Gen_Vx_Mask now supports the following types of masking definitions: 

MET’s Conditional Continuous Verification. Above panel shows the geographic bias of temperature at surface weather stations in 0.5 degree increments from -4 in purple to +4 in red. The mean bias over entire dataset is -0.43 K.
MET’s Conditional Continuous Verification. Above panel shows bias for all stations observed to be greater than 300 K. The mean bias for the warmer temperatures shows a greater cold bias of -0.87 K.
  1. Polyline (poly) masking reads an input ASCII file containing Lat/Lon locations. This option is useful when defining geographic sub-regions of a domain.
  2. Circle (circle) masking reads an input ASCII file containing Lat/Lon locations and for each grid point, computes the minimum great-circle arc distance in kilometers to those points. This option is useful when defining areas within a certain radius of radar locations.
  3. Track (track) masking reads an input ASCII file containing Lat/Lon locations of a “track” and for each grid point, computes the minimum great-circle arc distance in kilometers. This option is useful when defining the area within a certain distance of a hurricane track.
  4. Grid (grid) masking reads an input gridded data file, extracts the field specified using the its grid definition. This option is useful when using a model nest to define the corresponding area of the parent domain.
  5. Data (data) masking reads an input gridded data file, extracts the field specified by some threshold. The option is useful when thresholding topography to define a mask based on elevation or when thresholding land use to extract a particular category.

Additional examples of enhanced controls include the user being able to define a rapid intensification / rapid weakening event for a tropical cyclone in a more generic way with TC-Stat. This capability was then included in the Stat-Analysis tools to allow for identification of ramp events for renewables or extreme change events for other areas of study.

“The MET team strives to provide the NWP community with a state-of-the-art verification package where MET incorporates newly developed and advanced verification methodologies.”

New Statistics: In support of the need for expanded probabilistic verification capability of both regional and global ensembles, the MET team added a “climo_mean” specification to the Grid-Stat, Point-Stat, and Ensemble-Stat configuration files. If a climatological mean is included, the Anomaly Correlation is reported in the continuous statistics output. If a climatological or reference probability field is provided, Brier Skill Score and Continuous Ranked probability score are reported in the probabilistic score output. Additionally, the decomposition of the Mean Square Error field was also included in the continuous statistics computations. These options are particularly useful to the global NWP community and were added to address the needs of the NCEP/EMC Global Climate and Weather Prediction Branch.

In conclusion, the MET team strives to provide the NWP community with a state-of-the-art verification package. “State-of-the-art” means that MET will incorporate newly developed and advanced verification methodologies, including new methods for diagnostic and spatial verification but also will utilize and replicate the capabilities of existing systems for verification of NWP forecasts. We encourage those in the community to share your requirements, ideas, and algorithms with our team so that MET may better serve the entire verification community. Please contact us at met_help@ucar.edu.


Director's Corner

Tom Hamill

Contributed by Tom Hamill

I’d like to highlight some recent work in model diagnostics by my one-time colleague in NOAA Physical Science Division, Thomas Galarneau. Tom was funded under a DTC visitor’s program grant, with additional funding through the Hurricane Forecast Improvement Project. As a DTC visitor in 2013, Tom applied a new diagnostic method for quantifying the phenomena responsible for errors in tropical cyclone (TC) storm tracks to an inventory of recent hurricanes. (See a related article about Tom’s work in the DTC Newsletter Winter-Spring 2014, page 4.) Tom has since moved on to NCAR, and then more recently to the University of Arizona.

Readers are likely aware that the prediction of tropical cyclone track, intensity, and genesis in the medium-range (120–180-h forecast leads) continues to be a formidable challenge for operational numerical weather prediction models.

While 36–84-h TC track predictions from the operational NCEP Global Forecast System (GFS) have significantly improved over the last ten years, predictions for forecast leads beyond 120-h have shown no such improvement. In order to examine and diagnose medium-range forecasts for the NCEP GFS, Tom and his NCAR colleagues Chris Davis and Bill Kuo developed the Real-Time Diagnosis of GFS Forecasts website [http://www.atmo.arizona.edu/~tgalarneau/realtime/gfs_diagnostics.html] that provides analyses and diagnoses of GFS forecasts in real time. To complement other websites that show the statistics of GFS forecast performance, this website provides synoptic charts and diagnostic calculations to link model physical processes to the evolution of the synoptic-scale flow in the GFS forecast. Analyses and diagnostics are generated four times daily, and they provide information on how the GFS has behaved over the previous 60-day period. A wide variety of charts can be generated at the web site above.

Consider one relatively simple example of a systematic error in the GFS identified with this web site. Since its inception, continuous monitoring of the GFS forecasts has revealed that the GFS systematically loses atmospheric water vapor over the tropical west Pacific in quiet regimes during the summer months. It appears that the GFS atmosphere overturns early in the forecast, producing a positive rainfall bias in the day-1 forecast over the tropics. The GFS atmosphere does not recover from the stabilization following the early burst of rainfall due to a low surface flux bias. As a consequence, the GFS atmosphere continues to dry and stabilize through the medium-range, resulting in the negative rainfall bias over the tropics by day 7. The drier conditions make it difficult for the GFS to accurately predict TC genesis in the medium range. Examination of rainfall forecasts over the last 60 days of 2015 shows that the dry bias in the tropics is also a problem during the cool season. The attached figure shows a systematic inability of medium-range GFS forecast to maintain tropical rains associated with a westerly wind burst along the equator in the tropical west-central Pacific. With tropical cyclone formation and propagation affected by this bias, one can expect that tropical-midlatitude interactions in the eastern Pacific are affected, which of course can affect the accuracy of downstream forecasts over the US.

Identification of major systematic biases in our forecast model is the first step toward better predictions. I personally would like to see DTC do even more in this arena, producing diagnostics that further aid the model developer in teasing out the underlying sources of model biases. Can the systematic errors Tom identified be attributed to convective parameterizations? To cloud-radiative feedbacks? The faster we can diagnose the ultimate potential sources of forecast bias, the more rapidly we can reallocate the development resources to address them, thus speeding the rate of forecast system improvement. Tom and his colleagues pioneering work is a very admirable first step in this process, for which NOAA and the weather enterprise is grateful.

Tom Hamill is a research scientist who is interested in all aspects of ensemble weather and climate prediction, from data assimilation to stochastic parameterization to post-processing and verification. Tom also is currently a member of the DTC management board and is a co-chair of the World Meteorological Data Assimilation and Observing Systems working group.

Time-mean (a) CMORPH-derived * and (b) GFS day-7 forecast (0000 UTC initializations only) daily rainfall (shaded in mm) for the 60-day period ending on 1 Jan 2016. * NOAA’s Climate Prediction Center MORPHing (CMORPH) technique.


Who's Who

Michelle Harrold

Growing up in Chicago showed Michelle Harrold how to be an optimist. That happens while you wait for your favorite Cubs to finally win a World Series.

After completing her B.S. in Meteorology from Valparaiso, Michelle moved to Colorado State University for graduate work. She received her M.S. in Atmospheric Science in 2009. By the winter of 2010 she was working as a mesoscale modeler at UCAR. This year Michelle added to her tasks, making time to help with the Global Modeling Test Bed (GMTB).

In her spare time, Michelle loves to be outdoors, including hiking and camping, and skiing, although the latter caused a torn rotator cuff in her first year on the slopes. Michelle says she’d happily join the DTC skydiving club, should it ever start.

As if her DTC duties and active life away from work weren’t keeping Michelle busy enough, she was married in August and purchased a house this fall. And as a dog lover, she’s hoping to add a furry friend to the mix soon as well. Let’s hope Michelle’s active schedule needs to be interrupted next Fall while she roots for her hometown Cubs in the playoffs.


Bridges to Operations

HWRF Operational Implementation and Public Release

Contributed by Kathryn Newman

With the conclusion of the 2015 hurricane season, assessments of model performance indicate that the upgraded 2015 Hurricane WRF (HWRF) model provided superior forecast guidance to the National Hurricane Center (NHC), with marked improvements over the previous HWRF system.

The unified HWRF system, for which the DTC provides the operational codes to the research community, is a cornerstone of HWRF’s success.

The community HWRF modeling system was upgraded to version 3.7a on August 31, 2015.  This release includes all components

of the HWRF system, including: scripts, data preprocessing, vortex initialization, data assimilation, atmospheric and ocean models, coupler, postprocessor, and vortex tracker (see Figure on the left).  Additionally, the capability to perform idealized tropical cyclone simulations is included (Figure in upper right). The HWRF community modeling system currently has over 1100 registered users.  The DTC provides resources for these users through updates to the user webpage, online practice exercises, datasets, and extensive documentation consistent with the latest release code.  With the HWRF v3.7a release, the HWRF helpdesk was migrated to a new tracking system (hwrf-help@ucar.edu), providing support for all aspects of the code.  Information about obtaining the codes, datasets, documentations, and tutorials can be found at the DTC HWRF user webpage: http://www.dtcenter.org/HurrWRF/users.

The HWRF v3.7a public release is compatible with the NCEP 2015 operational implementation of HWRF.  The HWRF model consists of a parent domain and two storm following two-way interactive nest domains.  Starting with the 2015 operational season, the default HWRF horizontal resolution increased to 18/6/2 km (from 27/9/3 km), and NCEP expanded high-resolution deterministic tropical cyclone forecast numerical guidance to all global oceanic basins for operations.  NCEP is running HWRF configurations with reduced complexity for global basins other than the Atlantic and Eastern North Pacific basins operationally.  However, the HWRF public release includes flexibility and alternate configuration options, such as running with full complexity including atmosphere-ocean coupled mode with data assimilation for all oceanic basins.  Additionally, the HWRF v3.7a maintains backwards compatibility to run the 27/9/3 km resolution.  One unsupported capability of the HWRF system is the use of an HWRF ensemble.

Improvements to the HWRF physics for the 2015 operational HWRF system demonstrate successful R2O transitions facilitated by the DTC.  The DTC acts as a conduit for code management and R2O by maintaining the integrity of the unified HWRF code and assisting developers with transitioning their innovations into the operational code.  Specifically, the DTC successfully facilitated R2O transitions for upgrades to radiation parameterization and PBL improvements that were implemented for the 2015 operational HWRF system.


Visitors

Implementation and Validation of a Geo-Statistical Observation Operator for the Assimilation of Near Surface Winds in GSI

Visitor: Joël Bédard
Contributed by Joël Bédard

As a 2015 DTC visitor, Joël Bédard is working with Josh Hacker to apply a geo-statistical observation operator for the assimilation of near-surface winds in GSI for the NCEP Rapid Refresh (RAP) regional forecasting system.

Biases and representativeness errors limit the global influence of near-surface wind observations. Although many near-surface wind observations over land are available from the global observing system, they had not been used in data assimilation systems until recently and many are still unused. Winds from small islands, sub-grid scale headlands and tropical lands are still excluded from the UK Met Office data assimilation system, while other operational systems simply blacklist wind observations from land stations (e.g. Environment Canada). Similarly, the RAP systems uses strict quality control checks to prevent degrading the near-surface wind analysis due to representativeness errors.

Model Output Statistics (MOS) methods are often used for forecast post-processing, and Bédard et al. previously evaluated MOS for use in the data assimilation. Doing so increases the consistency between observations, analyses and forecasts. They also addressed representativeness and systematic error issues by developing a geo-statistical observation operator based on a multiple grid-point approach called GMOS (Geophysical Model Output Statistics). The idea behind this operator is that the nearest grid-points, or a simple interpolation of the surrounding grid-points, may not represent conditions at an observing station, especially if the station is located on complex terrain or coastal site. On the other hand, amongst the surrounding grid-points, there are generally one or several grid-points that are more representative of the observing site. Thus, GMOS uses a set of geo-statistical weights relating the closest NWP grid-points to the observation site. GMOS takes advantage of the correlation between resolved scales and unresolved scales to correct the stationary and isotropic components of the systematic and representativeness error associated with local geographical characteristics (e.g. surface roughness or coastal effects). As a result, GMOS attributes higher weights to the most representative grid-points and it better represents the meteorological phenomena onsite (see Figure).

Joël Bédard

Near-surface wind observations from ~5000 SYNOP (surface synoptic observations) stations were assimilated along with the operational assimilation dataset in Environment Canada global deterministic prediction system. Although results are encouraging, they are not statistically significant as a large quantity of observations are already assimilated in the system (14 million observations per day). With the objective of making a better use of near-surface wind observations and improving their impact on short-term tropospheric forecasts, this collaborative project aims at assimilating near-surface wind observations over land in the RAP system. To address the statistical significance issue, near-surface wind observations from all available surface stations located over the North American continent are considered (~20 000 SYNOP, Metar and Mesonet stations).

As of now, the GMOS operator was implemented in the GSI code and the operators statistical coefficients were obtained using historical data. The evaluation runs are currently ongoing.

Figure: Comparison of the Numerical Weather Prediction model representation of the surface roughness and topographic height with the multipoint linear regression weights at the North Cape site: (a) subset of the GEM-LAM (2.5km) horizontal grid superimposed on the site map; (b) multipoint linear regression weights; (c) modelled surface roughness; (d) modelled topographic height. Figure from Bédard et al., 2013.


PROUD Awards

HOWARD SOH, Software Engineer III, NSF NCAR RAL & DTC |

Howard Soh is a Software Engineer III with the NSF NCAR Research Applications Laboratory who contributes to the development and support of the Model Evaluation Tools (MET) statistical component of the METplus system at the DTC.

Howard splits his time between the National Security Applications Program (NSAP) and the Joint Numerical Testbed (JNT), but his contributions to METplus far exceed expectations for that allocation. He is a fully engaged and active member of the METplus team and is a leader in several critical aspects of MET: SonarQube static code analysis, Python embedding, NetCDF APIs, point observation data ingest, and adding support for unstructured grids. Howard also monitors the METplus Discussions forum, where users submit questions for help, and provides his expertise when needed. He often answers the questions via email or Slack well before the person monitoring Discussions for that day has even read the question!

The DTC is proud to recognize Howard for consistently demonstrating excellent technical ability, initiative, communication, and leadership skills with all of his team members. He is not only a talented software engineer on the METplus team, but is also eager to lead new development tasks, takes a proactive approach in supporting customers, is friendly and approachable, and is always happy to help the team.

Thank you, Howard, for all the work you do for your DTC colleagues, partners, and customers!

,