Coupled forecast run
Run coupled forecastThe operational HWRF, which runs in all basins, is an atmosphere-ocean coupled forecast system, which includes an atmospheric component (WRF-NMM), an ocean component (MPIPOM-TC), and the NCEP Coupler. Therefore, HWRF is a Multiple Program Multiple Data (MPMD) system which consists of three executables, WRF, MPIPOM-TC, and Coupler. After the ocean and atmosphere initializations are successfully completed, the coupled HWRF forecast can be submitted.
The wrapper script forecast_wrapper is responsible for calling the Python script exhwrf_forecast.py in the scripts/ directory. The wrapper script sets the number of tasks for the parallel forecast job. In operations, 505 tasks are used: 492 for the WRF forecast, 9 for the MPIPOM-TC, and 4 for the NCEP Coupler.
Start by entering the wrappers directory:
Next, copy and edit the qsub template according to the example.
Finally, submit the job:
The forecast job should take approximately 15 minutes to run. However, your runtime may vary.
While this job is running, the post and products jobs may be submitted, as shown in the workflow graphic at the bottom of this page. After reading the rest of this page, please proceed to the following pages and submit the post and products jobs.
In the standard output file from the batch script, you will find the line INFO: Forecast complete. Users will find outputs only for the first 12 h of the forecast in the ${WORKhwrf}/runwrf directory, since the forecast length is set to 12 hours in the configuration files. In the list below, the yyyy-mm-dd_hh_mm_ss string is replaced by a numerical date string.
-
wrfout_d01_yyyy-mm-dd_hh_mm_ss
-
wrfout_d02_yyyy-mm-dd_hh_mm_ss
-
wrfout_d03_yyyy-mm-dd_hh_mm_ss
-
wrfdiag_d01
-
wrfdiag_d02
-
wrfdiag_d03
-
hifreq_d03.htcf
After output is generated, users can visualize wrfout files from the coupled run using the ncview command, such as:
Visualizing ocean output files
MATLAB-based diagnostic tools are now available to plot SST, subsurface temperature, and ocean current vectors at various times throughout the forecast and at various zoom levels. In this tutorial, we will NOT conduct an exercise in plotting ocean output. For future reference, the users can consult file ${SCRATCH}/hwrfrun/sorc/pomtc/ocean_diag/matlab/readme, which explains how to use the tools.
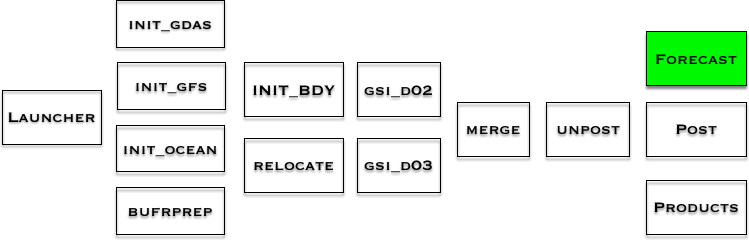
Where in the process of running HWRF?
This chart shows the workflow of the HWRF system. The green box(es) show the step(s) just completed. The components stacked together can be run simultaneously. The post_wrapper and products_wrapper can be submitted after the forecast_wrapper starts running.