This page provides sample scripts that may be run on MET output files to analyze, summarize, and/or plot the data. Feel free to modify these sample scripts to perform the type of analysis you need.
Users are encouraged to submit their own analysis scripts to be posted on this page by creating a new discussion in the Tips and Tricks section of the METplus GitHub Discussion page.
Python Scripts
Support for passing data to the MET tools in memory was added in MET version 8.0 as described in Appendix F of the MET User's Guide. Listed below are examples of using Python to pass data (ASCII, NetCDF, and Binary) to MET's plot_data_plane utility:
- Plot the 10-th record from NOAA/CPC Legacy GEFS binary dataset:
plot_data_plane PYTHON_NUMPY gefs_rec10.ps 'name="read_CPC_binary.py
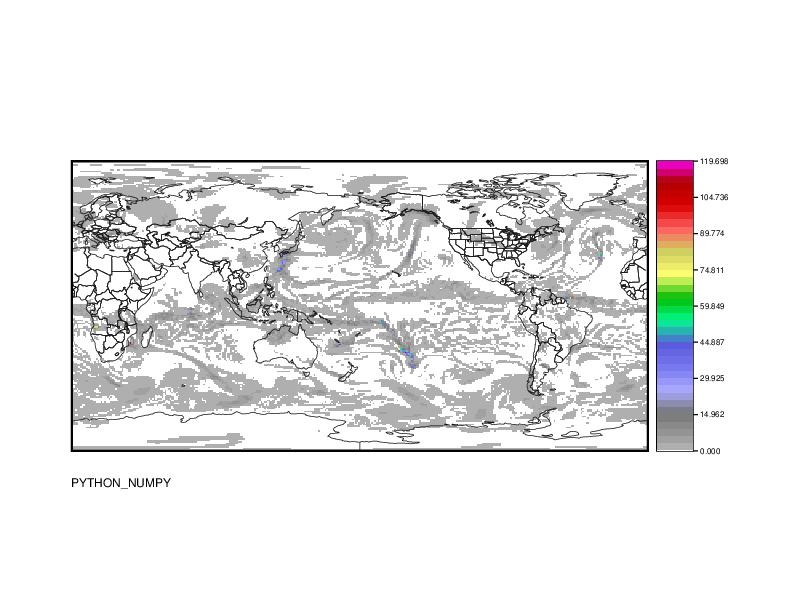
gefs-legacy-00z_rfcst-cal_tmean_20170807_8-14day.bin 10";' - Plot binary NRL 10-meter wind speed:
plot_data_plane PYTHON_NUMPY wind_z10.ps 'name="read_NRL_binary.py
wndspd_zht_0010.0_0000.0_glob360x181_2016122412_01200000_fcstfld";' - Plot binary NRL surface pressure:
plot_data_plane PYTHON_NUMPY pres_sfc.ps 'name="read_NRL_binary.py
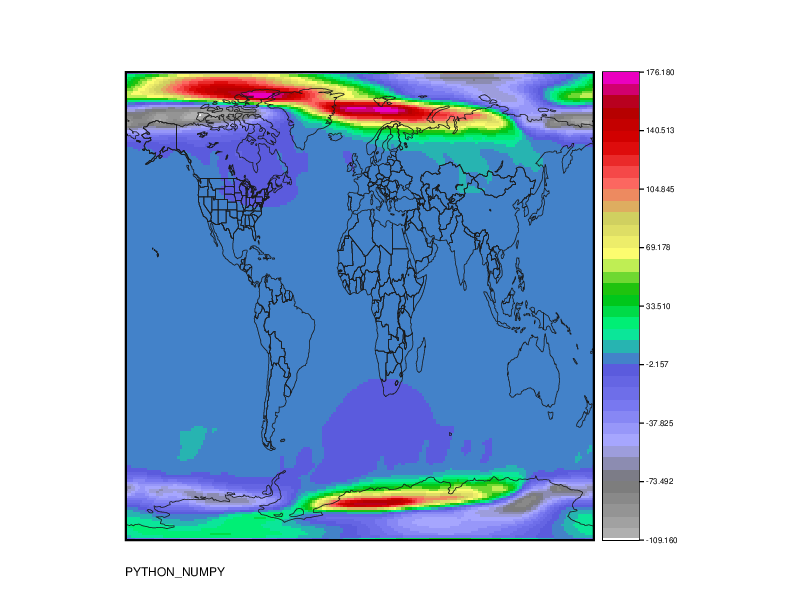
trpres_sfc_0000.0_0000.0_glob360x181_2013022712_00000000_fcstfld";' - Plot the TP_6h variable from an ECMWF NetCDF file:
plot_data_plane PYTHON_NUMPY tp_6h.ps 'name="read_ECMWF_NC_2D.py
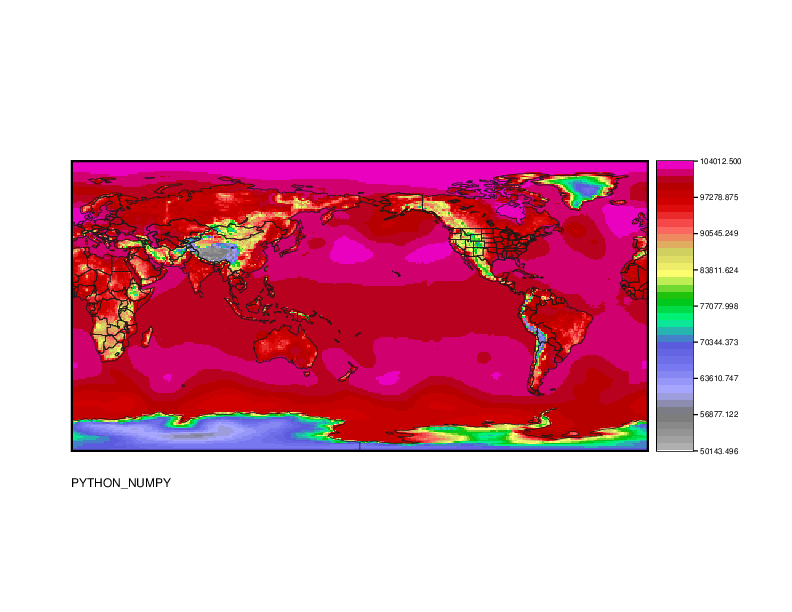
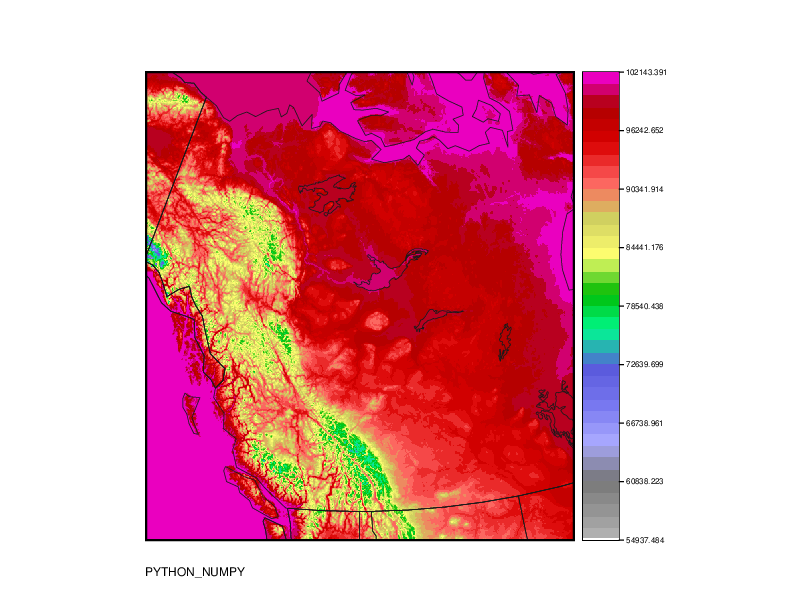
NR2006.pl.1by1.6522.2006012806.nc TP_6h";' - Plot the PSFC variable from a post-processed WRF output file on a Lambert Conformal projection:
plot_data_plane PYTHON_NUMPY psfc.ps 'name="read_PostProcessed_WRF.py
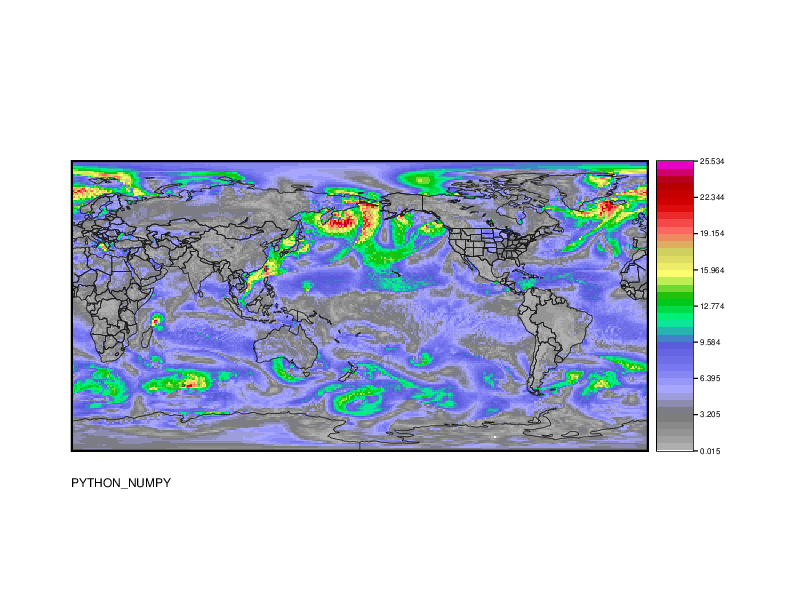
2004-09-01_04-00-00.nc PSFC";' - Plot 3B42RT 3-hourly precipitation data from NetCDF file:
plot_data_plane PYTHON_NUMPY precip_3h.ps 'name="read_3B42RT.py
3B42RT.2018082100.7.nc4 precipitation";' - Plot 3B42RT 24-hourly precipitation data from NetCDF file:
plot_data_plane PYTHON_NUMPY precip_24h.ps 'name="read_3B42RT.py
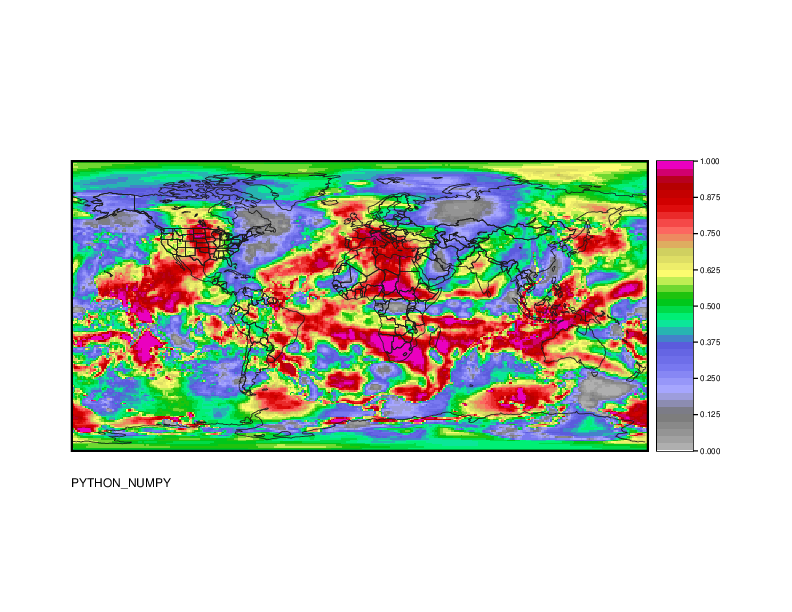
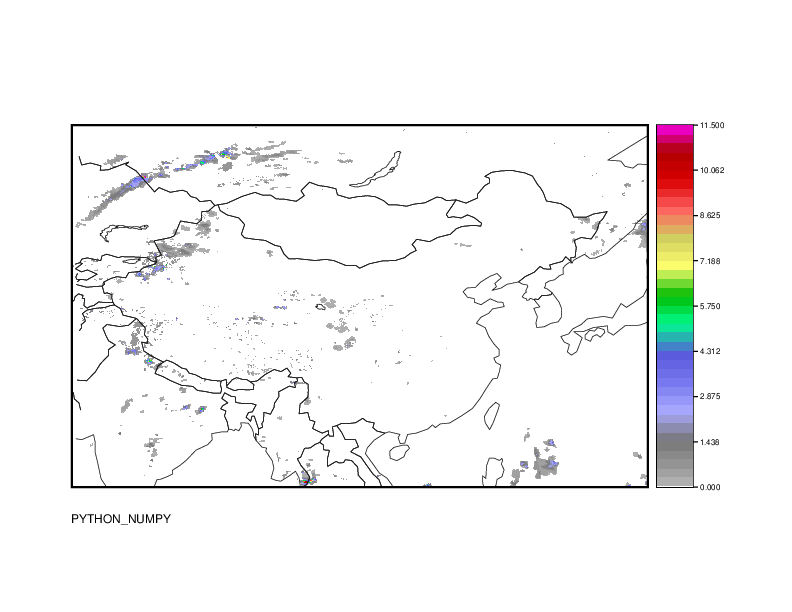
3B42RT_Daily.20180821.7.nc4 precipitation";' - Plot VIIRS AOD data from a NetCDF file:
plot_data_plane PYTHON_NUMPY viirs_aod.ps 'name="read_VIIRS_AOD_NetCDF.py
npp_eaot_ip_gridded_0.25_20181012.high.nc aot_ip_out";' - Plot ASCII CMORPH convective rain data:
plot_data_plane PYTHON_NUMPY crain.ps 'name="read_AWS_CMORPH.py
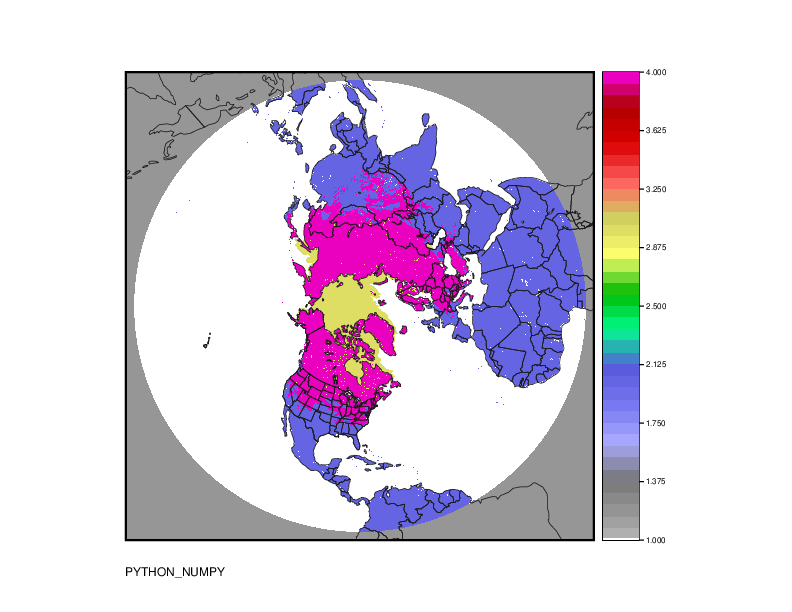
AWS_CMORPH_crain-2017043006.txt";' - Plot ASCII NSIDC Interactive Multisensor Snow and Ice Mapping system (IMS) data:
plot_data_plane PYTHON_NUMPY ims2017010_4km_v1.3.ps 'name="read_NSIDC_IMS_4km.py ims2017010_4km_v1.3.asc";' - Plot ASCII Calc DeltaB model data:
plot_data_plane PYTHON_NUMPY cdb.ps 'name="read_CDB_ascii.py pointdata_883280022096_20160809_082000.txt 4 geog";'
R Scripts
R is an extremely powerful statistical analysis and graphics package freely available for many platforms.
NOTE: The scripts provided below are meant purely as examples of using R to read and plot output from MET. Users are strongly encouraged to adapt these scripts for their own needs.
- Point-Stat and Grid-Stat Output:
- [UPDATED 02/03/2021] The plot_mpr.R script may be run to read matched pair (MPR) output lines from Point-Stat and generate histograms, scatter plots, and q-q plots. You may pass this script one or more ".stat" files, matched pair files (*_mpr.txt), or the output of a Stat-Analysis filter type job.
This sample PDF contains plots generated by running this script on the output of the Point-Stat test script. - [UPDATED 02/03/2021] The plot_cnt.R script may be run to read continuous statistics (CNT) output lines from Point-Stat and Grid-Stat. By default, it will create boxplots and time series plots of RMSE for each case. But a command line argument may be used to specify other CNT statistics to be plotted. You may pass this script one or more ".stat" files, continuous statistics files (*_cnt.txt), or the output of a Stat-Analysis filter type job.
This sample PDF contains plots generated by running this script.
- [UPDATED 02/03/2021] The plot_mpr.R script may be run to read matched pair (MPR) output lines from Point-Stat and generate histograms, scatter plots, and q-q plots. You may pass this script one or more ".stat" files, matched pair files (*_mpr.txt), or the output of a Stat-Analysis filter type job.
- MODE Output:
- The mode_summary.R script may be run to summarize the object statistics files from one or more MODE runs. The script keeps running sums of the counts and areas for the matched/unmatched forecast/observation objects. For each simple object identified, the script records its maximum interest value. It then dumps out the median value of those maximum interest values found.
This sample output summarizes a single MODE run. - The mode_quilt_plot.R script may be run to generate a quilt plot summarizing MODE output for several scales. A quilt plot may be generated when a single case is run using a variety of choices of convolution radii and thresholds. A quilt plot is an image where each box represents a summary measure of MODE for a given choice of radius and threshold.
The quilt plots shown in this sample PDF were generated by running the same case through MODE applying combinations of 29 different convolution radii and 30 different convolution thresholds.
- The mode_summary.R script may be run to summarize the object statistics files from one or more MODE runs. The script keeps running sums of the counts and areas for the matched/unmatched forecast/observation objects. For each simple object identified, the script records its maximum interest value. It then dumps out the median value of those maximum interest values found.
NCL Scripts
The NCAR Command Language (NCL) is commonly used to create plots of NetCDF data. Many users of NCL are migrating towards using Python instead. Here are some examples of NCL scripts that are used to plot MET output:
- MODE Output:
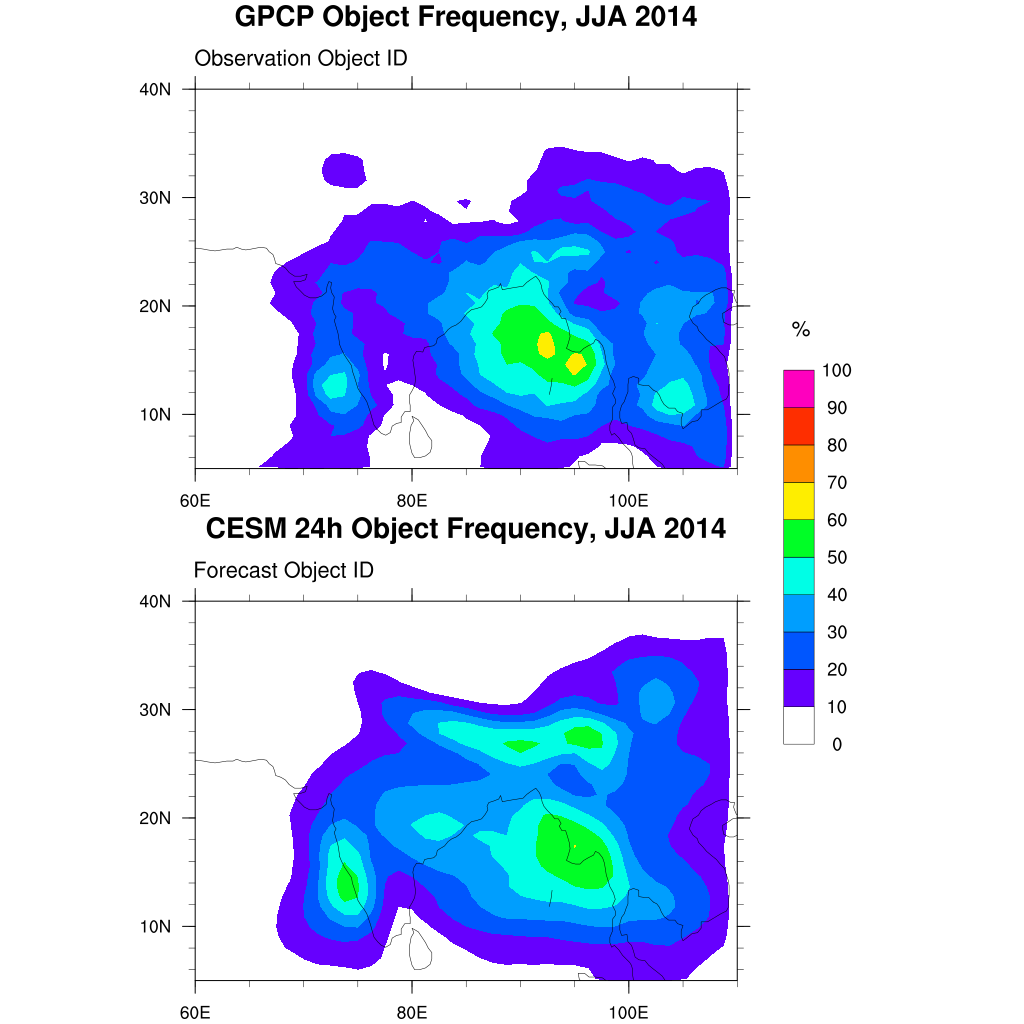
- Takes netCDF output from MODE and plots the frequency of objects on a map using the following command, designed for use on climate data:
- ncl plot_mode_frequency_objs.ncl 'input_path="path_to_nc_files/*.nc"'
- Output image
- Takes netCDF output from MODE and plots the frequency of objects on a map using the following command, designed for use on climate data: