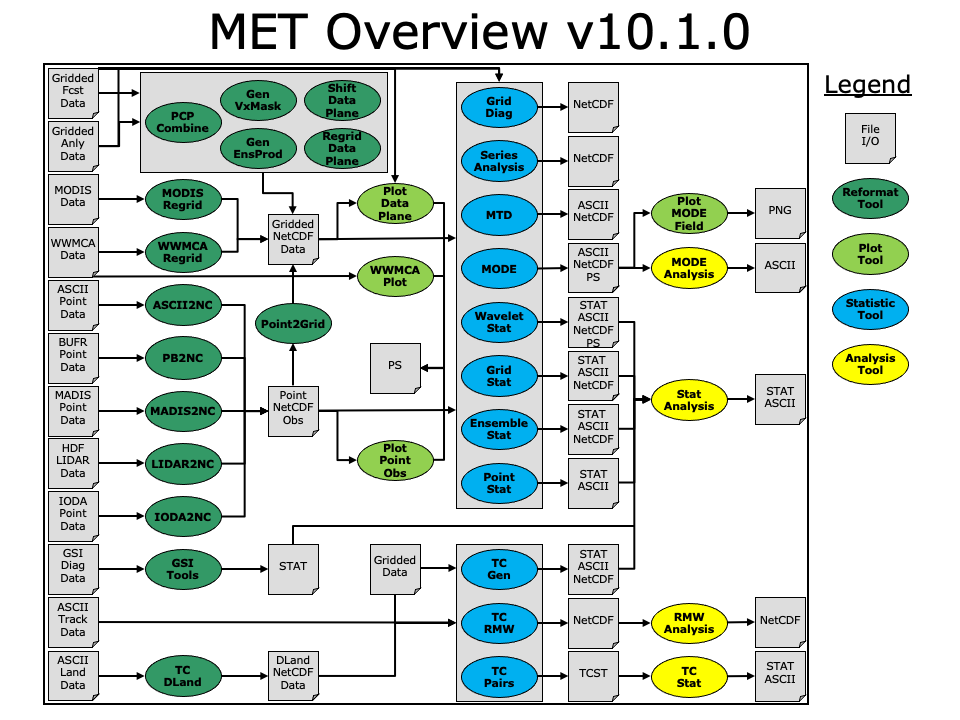
The major components of the MET package are represented in the figure below (Fig 1). The main stages represented are data reformatting, plotting, computation of statistics, analysis and aggregation, and Tropical Cyclone evaluation. The latest version of MET consists of many tools organized into 5 groups:
- Data inventory, reformatting, and preparation tools:
- PCP-Combine Tool
- Gen-Vx-Mask Tool
- Shift-Data-Plane Tool
- Regrid-Data-Plane Tool
- MODIS-Regrid Tool
- WWMCA-Regrid Tool
- ASCII2NC Tool
- PB2NC Tool
- MADIS2NC Tool
- LIDAR2NC Tool
- IODA2NC Tool
- Point2Grid Tool
- GSI Tools (gsid2mpr and gsidens2orank)
- GIS Inventory Tools (gis_dump_dbf, gis_dump_shp, and gis_dump_shx, not shown in flowchart)
- Gen-Ens-Prod Tool
- Plotting tools:
- Plot-Data-Plane
- WWMCA-Plot
- Plot-Point-Obs
- Plot-MODE-Field
- Statistical verification tools:
- MTD (MODE Time Domain) Tool
- Series-Analysis Tool
- MODE (Method For Object-Based Diagnostic Evaluation) Tool
- Wavelet-Stat Tool
- Grid-Stat Tool
- Ensemble-Stat Tool
- Point-Stat Tool
- Aggregation and analysis tools:
- MODE-Analysis Tool
- Stat-Analysis Tool
- Tropical Cyclone evaluation tools:
- TC-Dland
- TC-Pairs
- TC-Stat
- TC-Gen
- TC-RMW
- RMW-Analysis
PCP-Combine Tool
- Add, subtract, or sum up data from one or more gridded files.
- Typically applied to precipitation data.
- Write data to output NetCDF file.
- Optionally, run this tool prior to the statistics tools.
Gen-Vx-Mask Tool
- Read grid definition from input gridded data file and, optionally, read input mask field.
- Define a geographic masking region by reading an input Lat/Lon polyline file (poly, circle, or track masking) or gridded data file (grid or data masking).
- Optionally, apply logic (union, intersection, or symdiff) to combine the current mask with the input mask field.
- Write resulting masking data to output NetCDF file.
- Optionally, run this tool prior to the statistics tools to efficiently define a masking region once rather than redefining it many times.
Shift-Data-Plane Tool
- Read one field from input gridded data file.
- Define a rigid shift by specifying beginning and ending Lat/Lon locations within the domain.
- Translate the Lat/Lon change to an X/Y change in grid space and apply that rigid shift to all data points.
- Write shifted data to output NetCDF file.
- Optionally, run this tool prior to the statistics tools to investigate how a spatial offset affects performance.
Regrid-Data-Plane Tool
- Read one or more fields from input gridded data file.
- Define output grid as a named grid, the path to a gridded data file, or an explicit grid specification string.
- Regrid the input data to the output grid applying the user-specified interpolation options.
- Write regridded data to output NetCDF file.
- Optionally, run this tool prior to the statistics tools or use automated regridding within the statistics tools.
MODIS-Regrid Tool
- Regrid MODIS HDF data to a user-defined grid.
- Write output gridded NetCDF file that may be read by the other MET tools.
WWMCA-Regrid Tool
- Regrid the global WWMCA binary data to a user-defined grid.
- Write output gridded NetCDF file that may be read by the other MET tools.
ASCII2NC Tool
- Reformat point observations from ASCII to NetCDF.
- Currently supports little_R, SURFRAD, WWSIS, AERONET, and MET point observation formats.
PB2NC Tool
- Stratify the contents of PrepBufr files containing point observations.
- Write output to intermediate NetCDF format.
MADIS2NC Tool
- Reformat MADIS NetCDF point observations.
- Currently supports METAR, RAOB, PROFILER, MARITIME, MESONET, and ACARSPROFILES data types.
LIDAR2NC Tool
- Reformat CALIPSO satellite HDF point observations.
- Write output intermediate NetCDF format.
IODA2NC Tool
- Reformat NetCDF output from the Interface for Observational Data Access (IODA) Joint Effort for Data assimilation Integration (JEDI) system.
- Write output intermediate NetCDF format.
Point2Grid Tool
- Read point observations from the intermediate NetCDF files written by the point pre-processing tools and map them onto a user-specified grid.
- Write output gridded NetCDF file format.
GSID2MPR Tool
- Read one or more binary GSI diagnostic file(s) containing conventional or radiance data and reformat into the MET matched pair (MPR) output line type.
- Write several extra columns of data to the end of the MPR lines based on input data type.
- Run this tool to create MPR data and pass it to the Stat-Analysis tool to compute additional statistics.
GSIDENS2ORANK Tool
- Read ensemble of binary GSI diagnostic files containing conventional or radiance data and reformat into the MET observation rank (ORANK) output line type.
- Write several extra columns of data to the end of the ORANK lines based on input data type.
- Run this tool to create ensemble ORANK data and pass it to the Stat-Analysis tool to compute additional statistics.
GIS Inventory Tools
- The gis_dump_dbf, gis_dump_shp, and gis_dump_shx utilities inventory the contents of the Geographic Information System (GIS) files that are read by the Gen-Vx-Mask Tool.
- Read one GIS file and print contents to the screen.
Gen-Ens-Prod Tool
- Generate ensemble products by processing multiple gridded ensemble member forecasts and deriving common summary fields, such as ensemble mean, spread, and relative frequencies (i.e. probabilities).
- Write a gridded NetCDF output file which can be passed as input to the MET statistics tools.
Plot-Data-Plane Tool
- Extract a single 2-dimensional slice of data from a gridded data file and plot it.
- Write output PostScript plot.
WWMCA-Plot Tool
- Create a plot of the global WWMCA binary data.
- Write output PostScript plot.
Plot-Point-Obs Tool
- Create a plot showing the locations of the point observations contained in the NetCDF output of the ASCII2NC, PB2NC, or MADIS2NC tools.
- Write output PostScript plot.
MTD Tool
- Apply an object-based verification technique in comparing a gridded forecast to a gridded analysis.
- Define 3-dimensional space/time objects, tracking 2-dimensional objects through time.
- Write output to ASCII statistics files and write object fields to NetCDF format.
Series-Analysis Tool
- Define a series of gridded forecasts and gridded analyses and compute traditional verification scores over that series for each grid point to see how model performance varies spatially.
- Write gridded output NetCDF file with the user-requested set of statistics.
MODE Tool
- Apply an object-based verification technique in comparing a gridded forecast to a gridded analysis.
- Write output to ASCII statistics files, write object fields to NetCDF file, and generate a PostScript summary plot.
Wavelet-Stat Tool
- Apply an intensity-scale wavelet decomposition verification technique in comparing a gridded forecast to a gridded analysis.
- Write output to ASCII statistics files, write decomposed fields to NetCDF file, and generate a PostScript summary plot.
Grid-Stat Tool
- Compute traditional and neighborhood verification scores by comparing a gridded forecast to a gridded analysis.
- Write output to ASCII statistics files and write matched pairs to NetCDF file.
Ensemble-Stat Tool
- Process multiple gridded ensemble member forecasts and verify them against gridded analyses or point observations.
- Compute rank histograms, continuous ranked probability scores, spread-skill variance measures, and derive/verify relative frequencies (i.e. probabilities) on the fly.
- Write output to ASCII statistics files and gridded outputs to a NetCDF file.
Point-Stat Tool
- Compute traditional and neighborhood verification scores by comparing a gridded forecast to point observations (output of ASCII2NC, PB2NC, or MADIS2NC tools).
- Write output to ASCII statistics files.
Plot-MODE-Field Tool
- Read one or more MODE NetCDF output files, select the type of objects to be plotted, and create a PNG image for each input file.
MODE-Analysis Tool
- Compute aggregate object-based verification information across multiple cases.
- Filter contents of MODE object files based upon search parameters.
Stat-Analysis Tool
- Compute aggregate verification scores across multiple cases.
- Filter the contents of STAT files (output of the Point-Stat, Grid-Stat, Wavelet-Stat, and Ensemble-Stat tools) based upon search parameters.
TC-DLand Tool
- Parse land data file and compute distances to land over a regular grid.
- Write output gridded NetCDF file for use by the TC-Pairs tool.
TC-Pairs Tool
- Parse ADeck (forecast) and BDeck (BEST track analyses) ATCF files, filter the data, and match them up.
- Write output ASCII TCST (Tropical-Cyclone Statistics) file containing track pair information.
TC-Stat Tool
- Filter the TCST output of TC-Pairs based upon search parameters, define one or more columns of interest, and compute summary statistics.
- Write summary statistics to ASCII output.
TC-Gen Tool
- Read tropical cyclone genesis forecast data and compare it to BDeck track analyses.
- Apply user-specified temporal and spatial search criteria to determine matches and quantify the results using a contingency table.
- Write contingency table counts and statistics to ASCII statistics files.
TC-RMW Tool
- Read an ATCF track data file and a time series of corresponding gridded data files.
- For each track point, transform the user-specified gridded variables and levels into cylindrical coordinates centered on the current storm location.
- Write a NetCDF output file containing a time series of transformed data.
RMW-Analysis Tool
- Read the NetCDF output from one or more runs of the TC-RMW tool and aggregated results together across a filtered set of input file.
- Write a NetCDF output file containing the aggregated results.