Verification Statistics for Probabilistic Forecasts
Verification Statistics for Probabilistic Forecasts
Verification Statistics for Probabilistic Forecasts
The forecast types we’ve examined so far focused on dichotomous predictions of binary events (e.g.,. the tornado did or did not happen and the forecast did or did not predict the event); application of one or more thresholds; or specification of the value itself for the forecasted event (e.g.,. the observed temperature compared to a forecast of 85 degrees Fahrenheit). These forecast types determined how the verification statistics were calculated. But how are probabilistic datasets handled? When there is an uncertainty value attached to a meteorological event, what statistical measures can be used?
A common method to avoid dealing directly with probabilities is to convert forecasts from probabilistic space into deterministic space using a threshold. Consider an example rainfall forecast where the original forecast field is issued in tens values of probability (0%, 10%, 20% ... 80%, 90%, 100%). This could be converted to a deterministic forecast by establishing a threshold such as “the probability of rainfall will exceed 60%”. This threshold sets up a binary forecast (probabilities at or below 60% are “no” and probabilities above 60% are “yes”) and two separate observation categories (rain was observed or rain did not occur) that all of the occurrences and non-occurrences can be placed in. While the ability to access categorical statistics and scores is an obvious benefit to this approach, there are clear drawbacks to this method. The loss of probability information tied to the particular forecast value removes an immensely useful aspect of the forecast. As discussed previously, the general public may desire probability space information to make their own decisions: after all, what if someone’s tolerance for rainfall is lower than the 60% threshold used to calculate the statistics (e.g., the probability of rainfall will exceed 30%)?
Brier Score
One popular score for probability forecasts is the Brier Score (BS). Effectively a Mean Squared Error calculation, it is a scalar value of forecast accuracy that conveys the magnitude of the probability errors in the forecast.
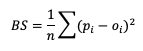
Here, pi is the forecast probability while oi is the binary representation of the observance of the event (1 if the event occurred, 0 if the event did not occur). This summation score is negatively oriented, with a 0 indicating perfect accuracy and 1 showing complete inaccuracy. The score is sensitive to the frequency of an event and should only be used on forecast-observation datasets that boast a substantial number of event samples.
Through substitutions, BS can be decomposed into three terms that describe the reliability, resolution, and uncertainty of the forecasts (more on these attributes can be found in the Attributes of Forecast Quality section). This decomposition is given as
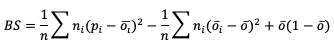
where the three terms are reliability, resolution, and uncertainty, respectively. ni is the count of probabilistic forecasts that fall into each probabilistic bin. See how to use this statistic in METplus!
Ranked Probability Score
A second statistical score to use for probabilistic forecasts is the Ranked Probability Score (RPS). This score differs from BS in that it allows the verification of multicategorical probabilistic forecasts where BS strictly pertains to binary probabilistic forecasts. While the RPS formula is based on a squared error at its core (similar to BS), it remains sensitive to the distance between the forecast probability and the observed event space (1 if the event occurred, 0 if it did not) by calculating the squared errors in cumulative probabilistic forecast and observation space. This formulation is represented in the following equation
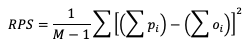
Note how RPS reduces to BS when there are only two forecast categories evaluated. In the equation, M denotes the number of categories the forecast is divided into. Because of the squared error usage, RPS is negative orientated with a 0 indicating perfect accuracy and 1 showing complete inaccuracy. See how to use this statistic in METplus!
Continuous Ranked Probability Score
Similar to the RPS’s approach to provide a probabilistic evaluation of multicategorical forecasts and the BS formulation as a statistic for binary probabilistic forecasts, the Continuous Ranked Probability Score (CRPS) provides a statistical measure for forecasts in the continuous probabilistic space. Theoretically this is equivalent to evaluating multicategorical forecasts that extend across an infinite number of categories that are infinitesimally small. When it comes to application, however, it becomes difficult to express mathematically a closed form of CRPS. Due to this restriction, CRPS often utilizes an assumption of a Gaussian (i.e. normal) distribution in the dataset and is presented as
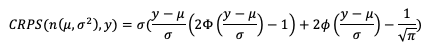
In this equation we use μ and σ to denote the mean and standard deviation of the forecasts, respectively, ɸ to represent the cumulative distribution function (CDF ) and 𝚽 to represent the probability density function (PDF) of the normal distribution. If you’ve previously evaluated meteorological forecasts, you know that the assumption that the dataset can be described by a Gaussian distribution is not always correct. Temperature and pressure variable fields, among others, can usually take advantage of this CRPS definition as they often are well fitted by a Gaussian distribution. But other important meteorological fields, such as precipitation, do not. Using statistics that are created with an incorrect assumption will produce, at best, misleading results. Be sure that your dataset follows a Gaussian distribution before relying on the above definition of CRPS!
The CRPS is negatively oriented with a 0 indicating perfect accuracy and 1 showing complete inaccuracy. See how to use this statistic in METplus!