METviewer is a display system based on the database that exists within the METplus framework. It is the intended tool of use when a "deep dive" on METplus statistical output is required, specifically the visual aspect. In the figure below (Figure 1), you can see the overall fit of METviewer into the METplus framework.
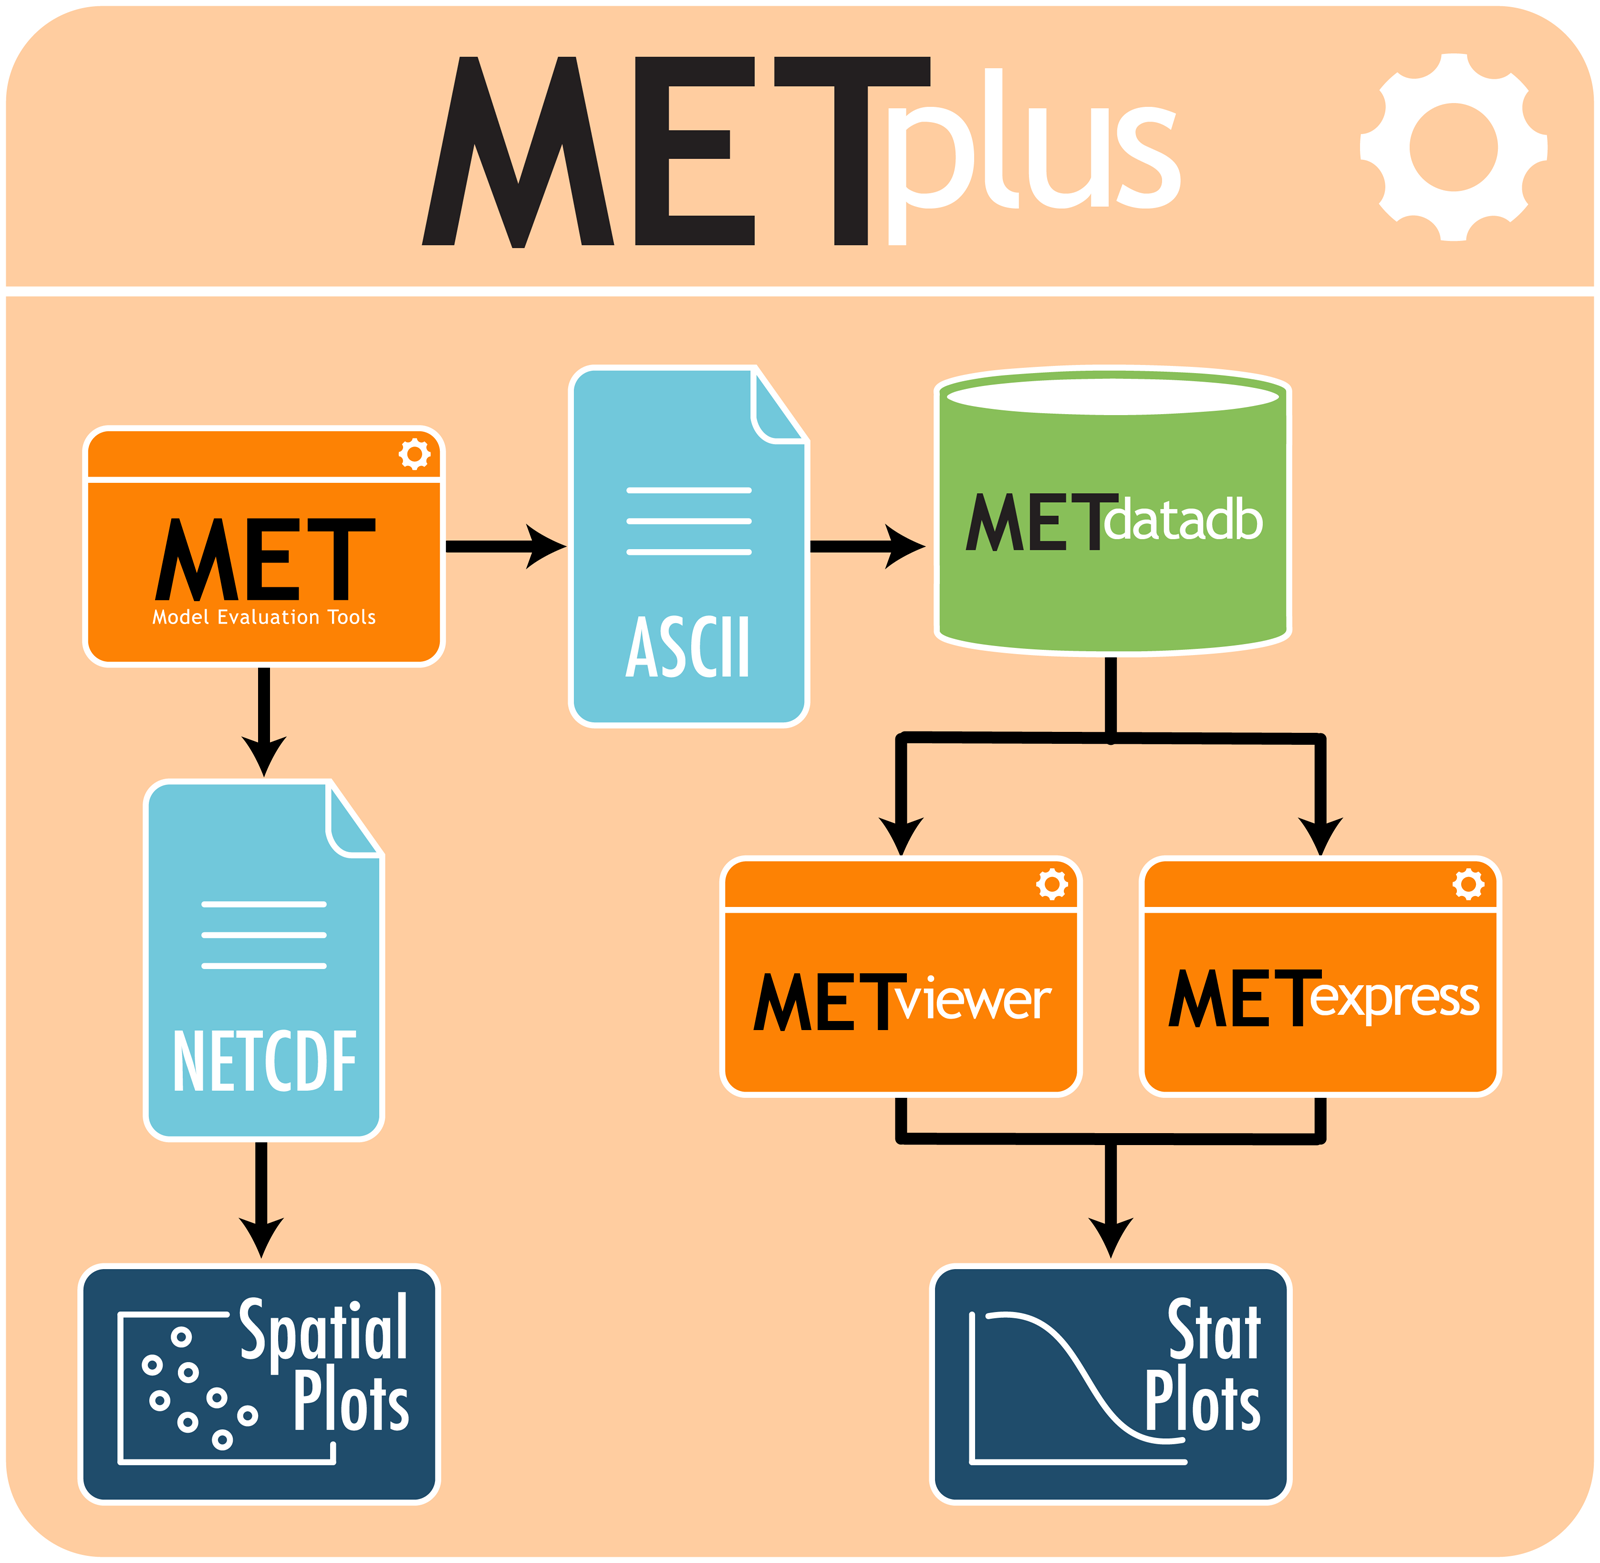
Figure 1. Depiction of METplus components
For a more detailed idea of how METviewer operates, Figure 2 is provided. MET output is loaded into a database by a loading script (Loader in Figure 2), and creates plots using the R statistical package. Running the R scripts can be accomplished via the web interface, or through the use of the batch engine and XML configuration files. If a user chooses the web application route, the specification for each plot is built using a series of form controls which are then serialized into XML.
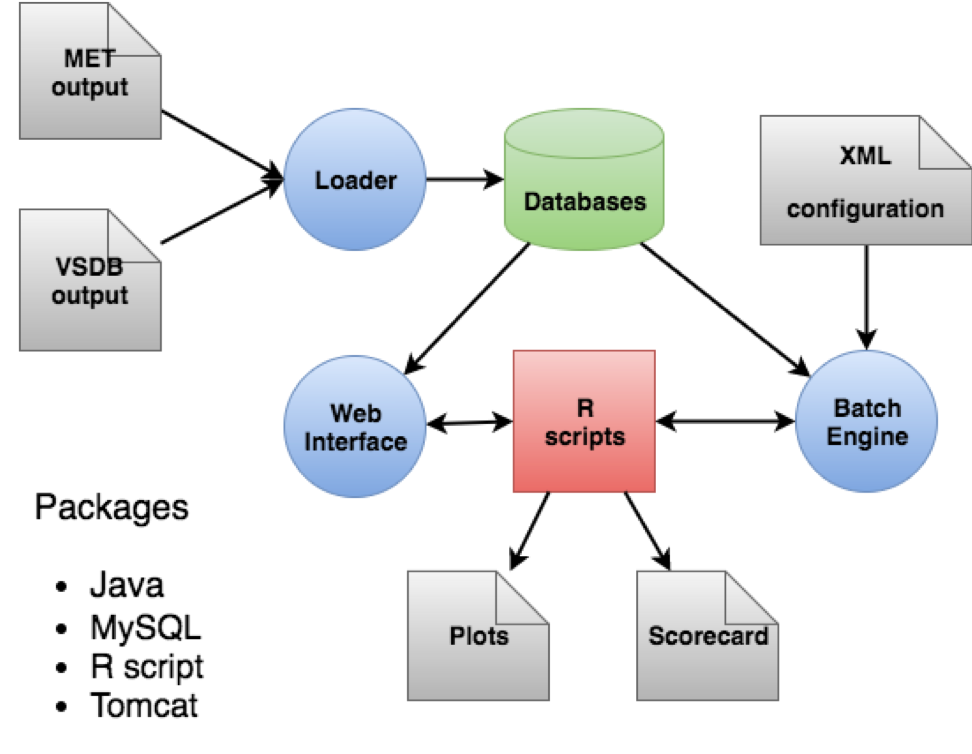
Figure 2. Depiction of METViewer workflow