METplus is best visualized as an overarching framework with individual components as depicted in the figure below (Figure 1). While the MET component serves as the central statistical tool, each additional component builds on the output or manages the workflow of MET and considerably enhances the utility of the tools and the user experience. By maintaining these components separately (as opposed to a single, large software system), the individual components can be learned more quickly by new users and provides flexibility and customization on a task-by-task basis.
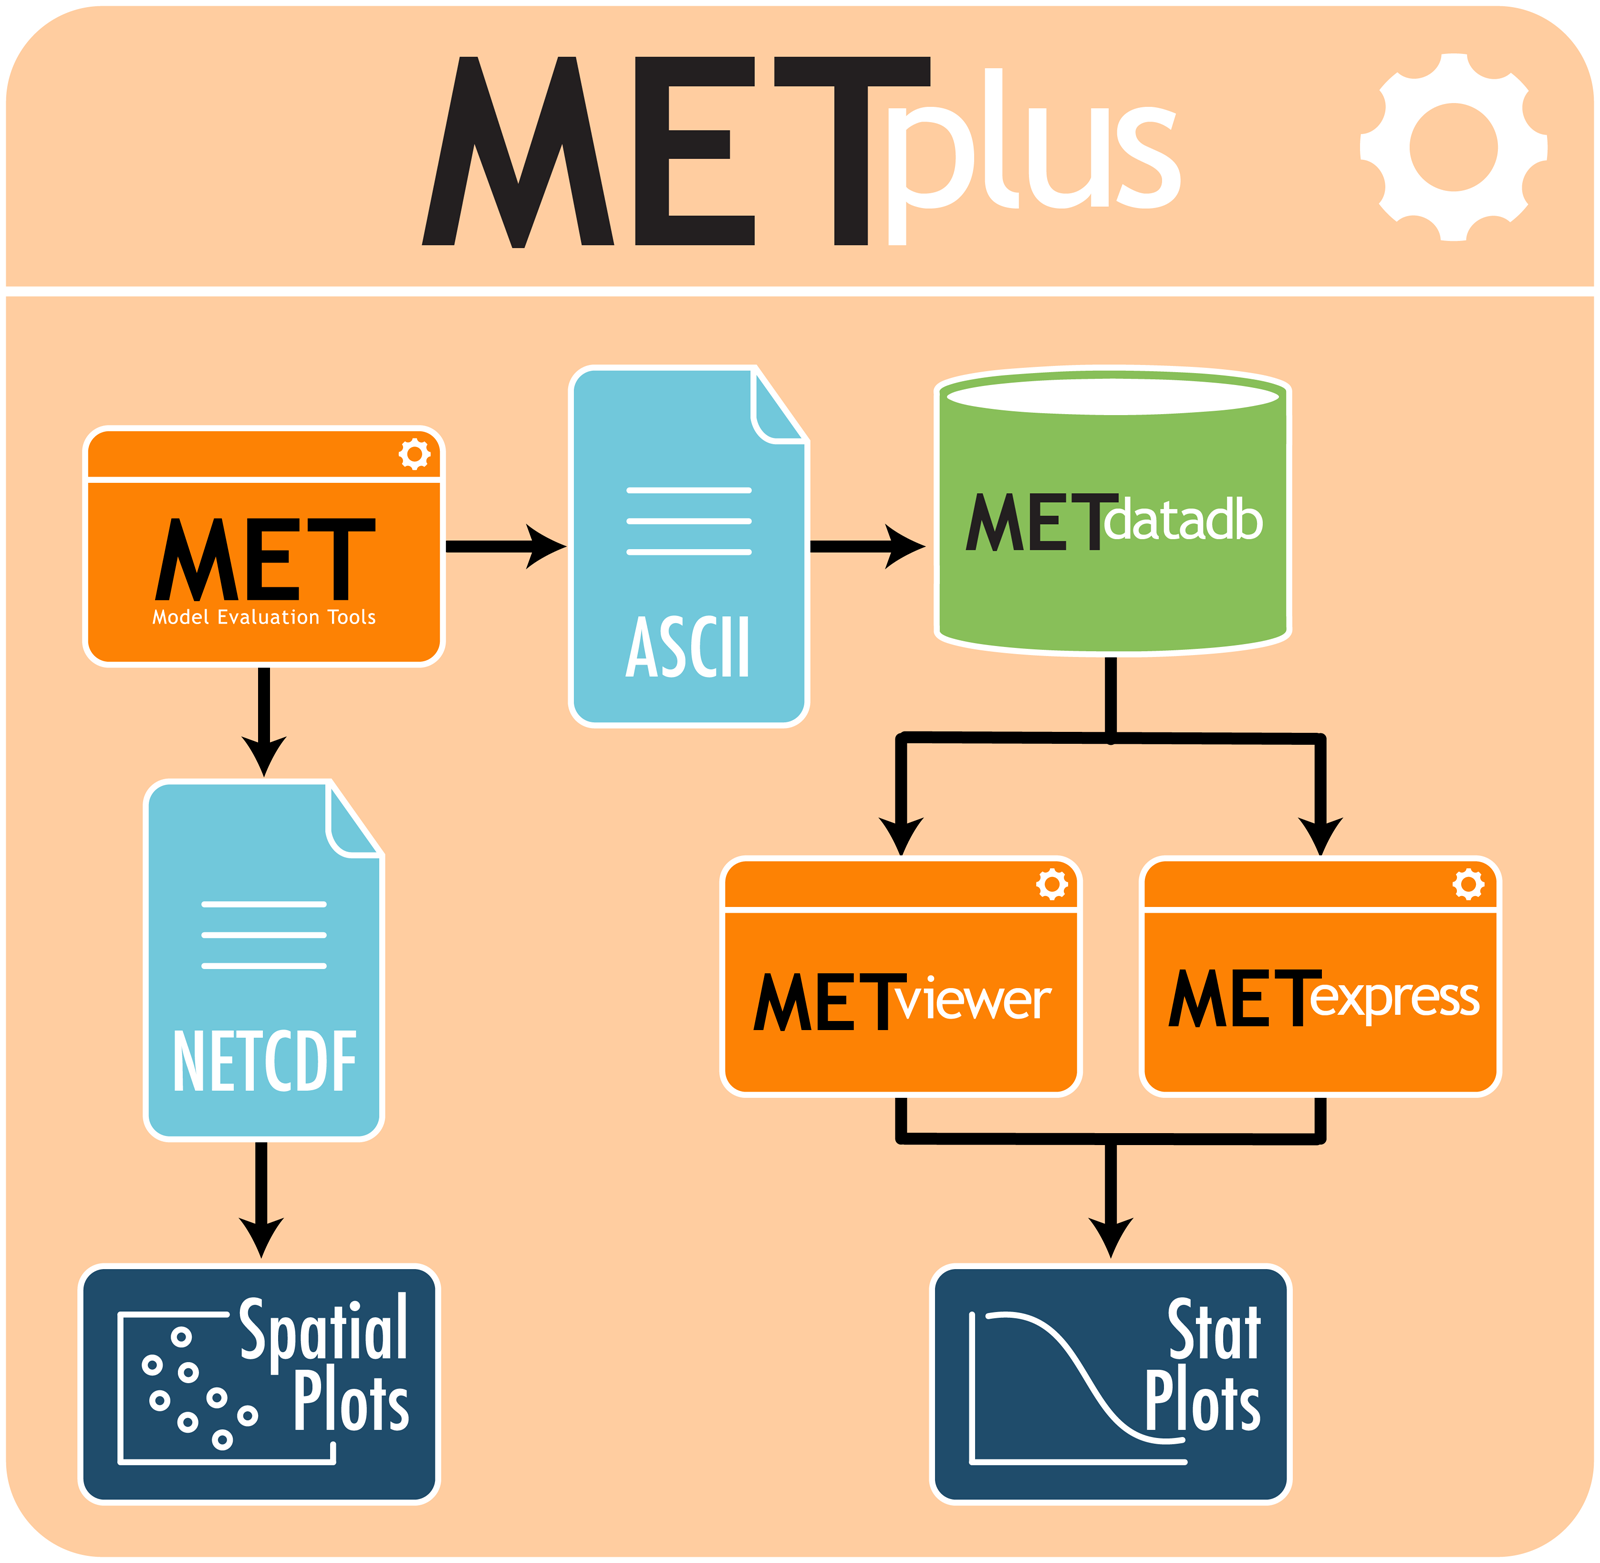
Figure 1. Depiction of METplus components
A description of each component is as follows:
-
MET - core statistical tool that matches up grids with either gridded analyses or point observations and applies configurable methods to compute statistics and diagnostics
-
METdatadb - database to store MET output and to be used by both METviewer and METexpress
-
METviewer - core database and display system intended for deep analysis of MET output
-
METexpress - core database and display system intended for quick analysis via pre-defined queries of MET output
-
METplus Python wrappers - suite of Python wrappers that provide low-level automation of MET tools and plotting capability