Introduction
Introduction
General
Model Evaluation Tools (MET) is a highly configurable, state-of-the-art suite of verification tools designed for the verification and evaluation of numerical weather forecasts. Although MET was developed at the Developmental Testbed Center (DTC) to be used with the Weather Research and Forecasting (WRF) modeling system, the data formats and standards used allow MET to be run on the output of other modeling systems as well.
The current MET capabilities include traditional verification approaches for standard surface and upper air variables; confidence intervals for most verification measures; spatial forecast verification methods; ensemble verification methods; and tropical cyclone track verification methods. The MET package is designed to be modular and flexible. Each tool can be run individually without running the entire set of tools. New tools can easily be added to the MET package due to this modular design.
Future MET development will take into account the needs of the NWP community - including operational centers and the research and development community.
Software Requirements
The following are required to build and run MET:
- C, C++, and Fortran compilers all from the same family (recommend GNU, PGI, or Intel compilers)
- The UNIX make (GNU make) utility
- The HDF5 library is required to support NetCDF4.
- Unidata's NetCDF4 library
- The GNU Scientific Library (GSL)
- NCEP's BUFRLIB for decoding point observations in PrepBufr format
- NCEP's GRIB2 C-Library with JASPER, PNG, and Z libraries for reading GRIB2 files (optional)
- The HDF4 and HDF-EOS2 libraries for using the MODIS-Regrid tool (optional)
- The Cairo and FreeType libraries for using the MODE-Graphics tool (optional)
- Python 2.7 for Python embedding to prepare 2D gridded data fields for reading by the MET tools (optional)
Additional Recommended Software
Although none of the following utilities are required to run MET, they may be helpful in preparing data for use in MET:
- The Unified Post-Processor for users verifying WRF model data
- The copygb utility for regridding GRIB data (also packaged with the Unified Post-Processor)
- The wgrib and wgrib2 utilities to inventory GRIB1 and GRIB2 files.
Program Flow
MET consists of a set of verification tools run from the command line. The current MET tools perform the following verification techniques:
- Prepare point observations for the Point-Stat and Ensemble-Stat tools using the PB2NC, ASCII2NC, and/or MADIS2NC tools.
- Prepare rainfall into desired accumulations for verification using the PCP-Combine tool.
- Compare a gridded forecast to point observations the Point-Stat tool.
- Compare a gridded forecast to a gridded analysis field using the Grid-Stat tool.
- Perform a grid-to-grid comparison over a series of fields, most commonly a time-series, using the Series-Analysis tool.
- Compare an ensemble of gridded forecasts to point and/or gridded observations using the Ensemble-Stat tool.
- Apply an object-based verification approach to a gridded forecast and gridded analysis field using the MODE tool.
- Apply an intensity-scale decomposition verification approach to a gridded forecast and gridded analysis field using the Wavelet-Stattool.
- Aggregate results across many cases using the Stat-Analysis and MODE-Analysis tools.
- Perform verification on ATCF (Automated Tropical Cyclone Forecasting) files using the MET-Tropical Cyclone (MET-TC) tools.
- Dump the contents of binary Gridpoint Statistical Interpolation (GSI) diagnostic files to ASCII format using the MET GSI tools and run the Stat-Analysis tool to derive statistics.
Documentation
MET Users Documentation consists of a detailed user's guide, slides from previous tutorials, and related white papers. Users are strongly encouraged to download and read the MET Users Guide before they start using MET.
Flow Chart
Flow Chart
MET Tools
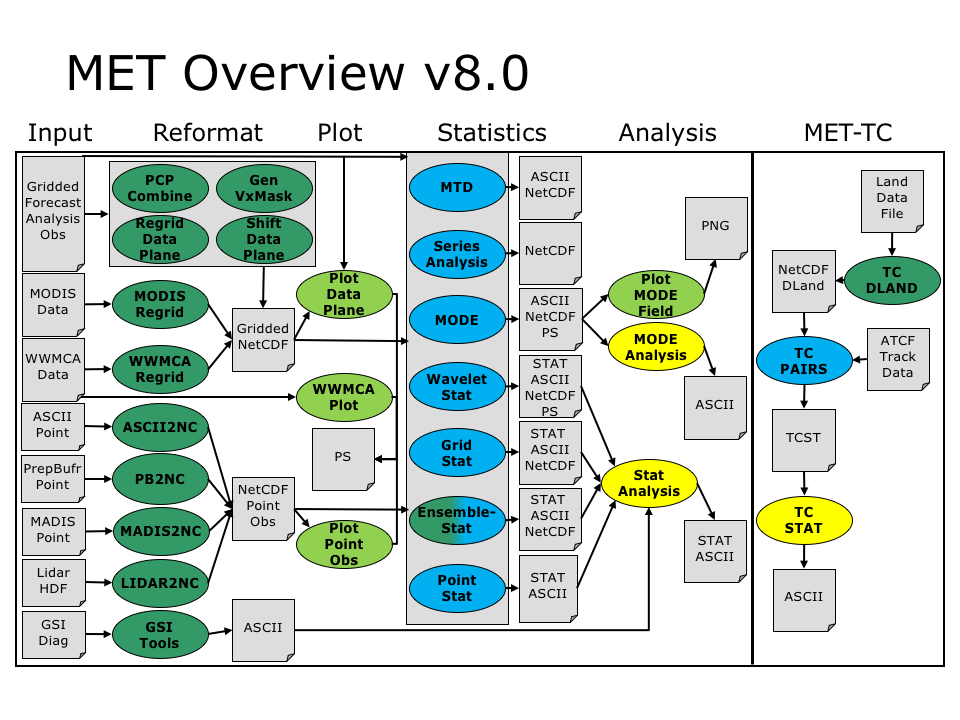
The major components of the MET package are represented in the figure below (Fig 1). The main stages represented are data reformatting, plotting, computation of statistics, analysis and aggregation, and Tropical Cyclone evaluation. MET Version 8.0 consists of 31 tools with the major components organized into 5 groups:
- Data reformatting and preparation tools:
- PCP-Combine Tool
- Gen-Vx-Mask Tool
- Shift-Data-Plane Tool
- Regrid-Data-Plane Tool
- MODIS-Regrid Tool
- WWMCA-Regrid Tool
- ASCII2NC Tool
- PB2NC Tool
- MADIS2NC Tool
- LIDAR2NC Tool
- GSI Tools (gsid2mpr and gsidens2orank)
- Ensemble-Stat Tool (also listed in statistics)
- Plotting tools:
- Plot-Data-Plane
- WWMCA-Plot
- Plot-Point-Obs
- Plot-MODE-Field
- Statistical verification tools:
- MTD (MODE Time Domain) Tool
- Series-Analysis Tool
- MODE (Method For Object-Based Diagnositic Evaluation) Tool
- Wavelet-Stat Tool
- Grid-Stat Tool
- Ensemble-Stat Tool (also listed in reformatting)
- Point-Stat Tool
- Aggregation and analysis tools:
- MODE-Analysis Tool
- Stat-Analysis Tool
- Tropical Cyclone evaluation tools:
- TC-Dland
- TC-Pairs
- TC-Stat
In addition to the major components listed above, the MET package also has three tools that enable the users to examine the contents of shapefiles:
- gis_dump_shp
- gis_dump_shx
- gis_dump_dbf
PCP-Combine Tool
- Add, subtract, or sum up data from one or more gridded files.
- Typically applied to precipitation data.
- Write data to output NetCDF file.
- Optionally, run this tool prior to the statistics tools.
Gen-Vx-Mask Tool
- Read grid definition from input gridded data file and, optionally, read input mask field.
- Define a geographic masking region by reading an input Lat/Lon polyline file (poly, box, circle, or track masking) or gridded data file (grid and data masking and solar altitude and solar azimuth masking).
- Define a latitude and longitude masking region using the definition of the grid, specified by the input file.
- Define a shapefile masking region defined by a closed polygon from an ESRI shapefile.
- Optionally, apply logic (union, intersection, or symdiff) to combine the current mask with the input mask field.
- Write resulting masking data to output NetCDF file.
- Optionally, run this tool prior to the statistics tools to efficiently define a masking region once rather than redefining it many times.
Shift-Data-Plane Tool
- Read one field from input gridded data file.
- Define a rigid shift by specifying beginning and ending Lat/Lon locations within the domain.
- Translate the Lat/Lon change to an X/Y change in grid space and apply that rigid shift to all data points.
- Write shifted data to output NetCDF file.
- Optionally, run this tool prior to the statistics tools to investigate how a spatial offset affects performance.
Regrid-Data-Plane Tool
- Read one or more fields from input gridded data file.
- Define output grid as a named grid, the path to a gridded data file, or an explicit grid specification string.
- Regrid the input data to the output grid applying the user-specified interpolation options.
- Write regridded data to output NetCDF file.
- Optionally, run this tool prior to the statistics tools or use automated regridding within the statistics tools.
MODIS-Regrid Tool
- Regrid MODIS HDF data to a user-defined grid.
- Write output gridded NetCDF file that may be read by the other MET tools.
WWMCA-Regrid Tool
- Regrid the global WWMCA binary data to a user-defined grid.
- Write output gridded NetCDF file that may be read by the other MET tools.
ASCII2NC Tool
- Reformat point observations from ASCII to NetCDF.
- Currently supports little_R, SURFRAD, WWSIS, AERONET, and MET point observation formats.
PB2NC Tool
- Stratify the contents of PrepBufr files containing point observations.
- Write output to intermediate NetCDF format.
MADIS2NC Tool
- Reformat MADIS NetCDF point observations.
- Currently supports METAR, RAOB, PROFILER, MARITIME, MESONET, and ACARSPROFILES data types.
LIDAR2NC Tool
- Reformat HDF4 Calipso data files into a NetCDF point observation format for use by Point-Stat and Ensemble-Stat.
GSID2MPR Tool
- Read one or more binary GSI diagnostic file(s) containing conventional or radiance data and reformat into the MET matched pair (MPR) output line type.
- Write several extra columns of data to the end of the MPR lines based on input data type.
- Run this tool to create MPR data and pass it to the Stat-Analysis tool to compute additional statistics.
GSIDENS2ORANK Tool
- Read ensemble of binary GSI diagnostic files containing conventional or radiance data and reformat into the MET observation rank (ORANK) output line type.
- Write several extra columns of data to the end of the ORANK lines based on input data type.
- Run this tool to create ensemble ORANK data and pass it to the Stat-Analysis tool to compute additional statistics.
Plot-Data-Plane Tool
- Extract a single 2-dimensional slice of data from a gridded data file and plot it.
- Write output PostScript plot.
WWMCA-Plot Tool
- Create a plot of the global WWMCA binary data.
- Write output PostScript plot.
Plot-Point-Obs Tool
- Create a plot showing the locations of the point observations contained in the NetCDF output of the ASCII2NC, PB2NC, or MADIS2NC tools.
- Write output PostScript plot.
Plot-MODE-Field Tool
- Read one or more MODE NetCDF output files, select the type of objects to be plotted, and create a PNG image for each input file.
MTD (MODE Time Domain) Tool
- Apply an object-based verification technique in comparing a gridded forecast to a gridded analysis.
- Define 3-dimensional space/time objects, tracking 2-dimensional objects through time.
- Write output to ASCII statistics files and write object fields to NetCDF format.
Series-Analysis Tool
- Define a series of gridded forecasts and gridded analyses and compute traditional verification scores over that series for each grid point to see how model performance varies spatially.
- Write gridded output NetCDF file with the user-requested set of statistics.
MODE Tool
- Apply an object-based verification technique in comparing a gridded forecast to a gridded analysis.
- Write output to ASCII statistics files, write object fields to NetCDF file, and generate a PostScript summary plot.
Wavelet-Stat Tool
- Apply an intensity-scale wavelet decomposition verification technique in comparing a gridded forecast to a gridded analysis.
- Write output to ASCII statistics files, write decomposed fields to NetCDF file, and generate a PostScript summary plot.
Grid-Stat Tool
- Compute traditional and neighborhood verification scores by comparing a gridded forecast to a gridded analysis.
- Write output to ASCII statistics files and write matched pairs to NetCDF file.
Ensemble-Stat Tool
- Process multiple ensemble forecasts and derive common summary fields, such as ensemble mean, spread, and relative frequency. These output fields may be verified using other MET statistics tools.
- If observations are provided, also compute rank histograms, continuous ranked probability scores, and spread-skill variance measures.
- Write output to ASCII statistics files and write ensemble fields to NetCDF file.
Point-Stat Tool
- Compute traditional and neighborhood verification scores by comparing a gridded forecast to point observations (output of ASCII2NC, PB2NC, or MADIS2NC tools).
- Write output to ASCII statistics files.
MODE-Analysis Tool
- Compute aggregate object-based verification information across mulitple cases.
- Filter contents of MODE object files based upon search parameters.
Stat-Analysis Tool
- Compute aggregate verification scores across mulitple cases.
- Filter the contents of STAT files (output of the Point-Stat, Grid-Stat, Wavelet-Stat, and Ensemble-Stat tools) based upon search parameters.
TC-DLand Tool
- Parse land data file and compute distances to land over a regular grid.
- Write output gridded NetCDF file for use by the TC-Pairs tool.
TC-Pairs Tool
- Parse ADeck (forecast) and BDeck (BEST track analyses) ATCF files, filter the data, and match them up.
- Write output ASCII TCST (Tropical-Cyclone Statistics) file containing track pair information.
TC-Stat Tool
- Filter the TCST output of TC-Pairs based upon search parameters, define one or more columns of interest, and compute summary statistics.
- Write summary statistics to ASCII output.
Data Formats
Data Formats
Forecast Data
MET is designed to verify gridded forecast products. The gridded forecast data MET reads generally in either GRIB1 format, GRIB2 format, CF-Compliant NetCDF, or as the NetCDF output of the WRF-ARW wrf_interp tool. Pre-processing tools, such as MODIS-Regrid and WWMCA-Regrid, are provide to reformat select binary data into a NetCDF format for use in MET. If rebinning of accumulation intervals is required, the PCP-Combine tool can convert the input gridded data into a NetCDF format that can be used in the statistical verification tools (Point-Stat, Grid-Stat, Wavelet-Stat, Ensemble-Stat, MODE, and Series-Analysis).
Users may choose to reformat their gridded data from some other format to the intermediate NetCDF format used by the PCP-Combine tool for use with MET. Support for CF-Compliant NetCDF files was added in METv5.0. Please send email to met_help@ucar.edu if you have trouble with your CF-Compliant files.
Point Observations
Point observations used in MET may either be in PrepBufr format (converted using PB2NC), ASCII format (converted using ASCII2NC), or NetCDF MADIS format (converted using MADIS2NC). The NetCDF output of PB2NC, ASCII2NC, and MADIS2NC is used as input to the Point-Stat and Ensemble-Stat tools.
Gridded Analyses
Gridded analyses can be used for model evaluation in MET. The same data formats listed above for forecast data are supported here.
Case Study
Case Study
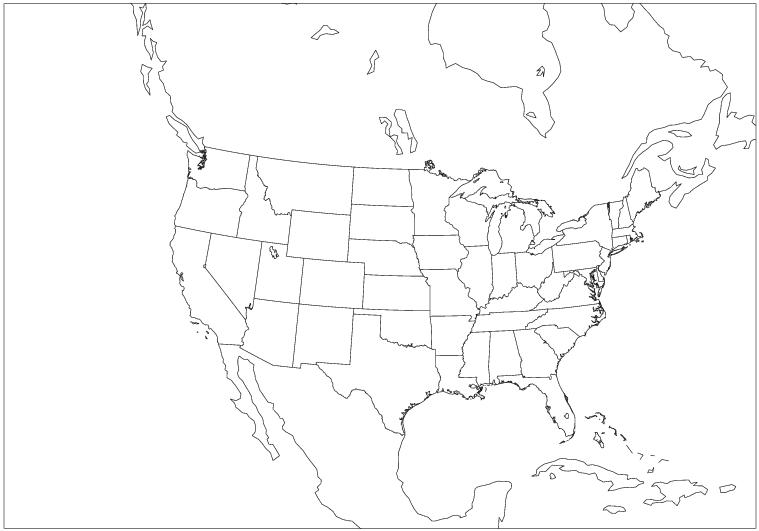
Sample data is distributed with the MET tarball. This sample data is contained in the input/sample_fcst and the input/sample_obs subdirectories. The sample forecast data is the GRIB output of the Unified Post-Processor. The majority of it resides on a 185 by 129 Lambert Conformal grid over the Continental United States (NCEP Grid 212), and it will be used throughout this tutorial. The domain is depicted below.