Session 6: Track and Intensity
Session 6: Track and Intensity
METplus Practical Session 6
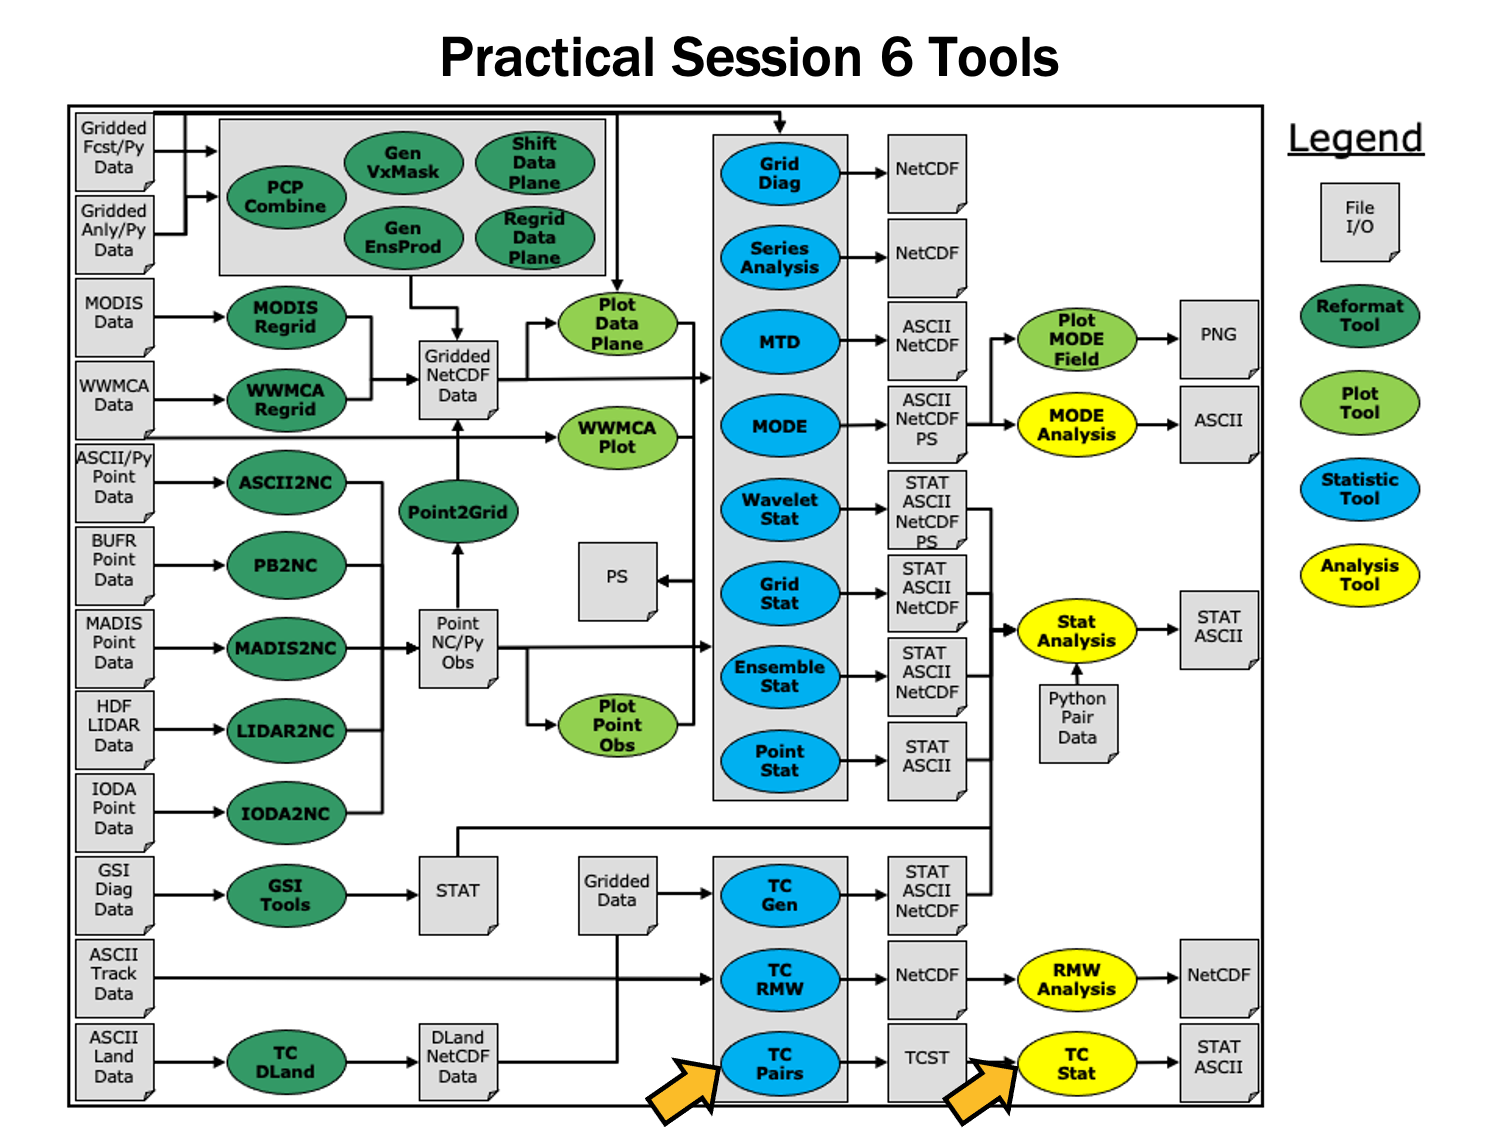
During this practical session, you will run the tools indicated below:
Since you already set up your runtime enviroment in Session 1, you should be ready to go! To be sure, run through the following instructions to check that your environment is set correctly.
Prerequisites: Verify Environment is Set Correctly
Before running the tutorial instructions, you will need to ensure that you have a few environment variables set up correctly. If they are not set correctly, the tutorial instructions will not work properly.
EDIT AFTER COPYING and BEFORE HITTING RETURN!
source METplus-5.0.0_TutorialSetup.sh
echo ${METPLUS_BUILD_BASE}
echo ${MET_BUILD_BASE}
echo ${METPLUS_DATA}
ls ${METPLUS_TUTORIAL_DIR}
ls ${METPLUS_BUILD_BASE}
ls ${MET_BUILD_BASE}
ls ${METPLUS_DATA}
METPLUS_BUILD_BASE is the full path to the METplus installation (/path/to/METplus-X.Y)
MET_BUILD_BASE is the full path to the MET installation (/path/to/met-X.Y)
METPLUS_DATA is the location of the sample test data directory
ls ${METPLUS_BUILD_BASE}/ush/run_metplus.py
See the instructions in Session 1 for more information.
You are now ready to move on to the next section.
MET Tool: TC-Pairs
MET Tool: TC-Pairs
TC-Pairs Tool: General
TC-Pairs Functionality
The TC-Pairs tool provides position and intensity information for tropical cyclone forecasts in Automated Tropical Cyclone Forecast System (ATCF) format. Much like the Point-Stat tool, TC-Pairs produces matched pairs of forecast model output and an observation dataset. In the case of TC-Pairs, both the model output and observational dataset (or reference forecast) must be in ATCF format. TC-Pairs produces matched pairs for position errors, as well as wind, sea level pressure, and distance to land values for each input dataset.
TC-Pairs Usage
View the usage statement for TC-Pairs by simply typing the following:
| Usage: tc_pairs | ||
| -adeck source | Input ATCF format track files | |
| -edeck source | Input ATCF format ensemble probability files | |
| -bdeck source | Input ATCF format observation (or reference forecast) file path/name | |
| -config file | Configuration file | |
| [-out_base] | path of output file base | |
| [-log_file] | name of log associated with tc_pairs output | |
| [-v level] | Level of logging (optional) |
At a minimum, the input ATCF format -adeck (or -edeck) source, the input ATCF format -bdeck source, and the configuration -config file must be passed in on the command line.
The -adeck, -edeck, and -edeck options can be set to either a specific file name or a top-level directory which will be searched for files ending in ".dat".
Input format
Input format
TC-Pairs input data format
As mentioned previously, the input to TC-Pairs is two ATCF format files, in addition to the distance_to_land.nc file generated with the TC-Dland tool. The ATCF file format is a comma-separated ASCII file containing the following fields:
| Basin | basin | |
| CY | annual cyclone number (1-99) | |
| YYYYMMDDHH | Date - Time - Group | |
| TECHNUM/MIN | Objective sorting technique number, minutes in Best Track | |
| TECH | acronym for each objective technique | |
| TAU | forecast period | |
| LatN/S | Latitude for the date time group | |
| LonE/W | Longitude for date time group | |
| VMAX | Maximum sustained wind speed | |
| MSLP | Minimum sea level pressure | |
| TY | Highest level of tropical cyclone development | |
| RAD | wind intensity for the radii at 34, 50, 64 kts | |
| WINDCODE | radius code | |
| RAD1 | full circle radius of wind intensity, 1st quadrant wind intensity | |
| RAD2 | radius of 2nd quadrant wind intensity | |
| RAD3 | radius of 3rd quadrant wind intensity | |
| RAD4 | radius of 4th quadrant wind intensity | |
| ... |
These are the first 17 columns in the ATCF file format. MET-TC requires the input file has all 17 comma-separated columns present (although valid data is not required). For a full list of the columns as well as greater detail on the file format, see: http://www.nrlmry.navy.mil/atcf_web/docs/database/new/abdeck.txt
Model data must be run through a vortex tracking algorithm prior to becoming input for MET-TC. Running a vortex tracker is outside the scope of this tutorial, however a freely available and supported vortex tracking software is available at:https://dtcenter.org/community-code/gfdl-vortex-tracker/download
If users choose to use operational model data for input to MET-TC, all U.S. operational model output in ATCF format can be found at: ftp://ftp.nhc.noaa.gov/atcf/archive. Finally, the most common use of MET-TC is to use the best track analysis (used as observations) to generate pairs between the model forecast and the observations. Best track analyses can be found at the same link as the operational model output.
Open files aal112017.dat (model data) and bal112017.dat (BEST track). Take a look at the columns and gain familiarity with ATCF format. These files are input ATCF files for TC-Pairs.
In addition to the files above, data from five total storms over hurricane seasons 2011-2012 in the AL basin will be used to run TC-Pairs. Rather than running a single storm, these storms were chosen to provide a larger sample size to provide more robust statistics.
- aal092011: Irene
- aal182011: Rina
- aal052012: Ernesto
- aal092012: Isaac
- aal182012: Sandy
Configure
Configure
TC-Pairs Tool: Configure
Start by making an output directory for TC-Pairs and changing directories:
cd ${METPLUS_TUTORIAL_DIR}/output/met_output/tc_pairs
Like the Point-Stat tool, the TC-Pairs tool is controlled by the contents of the configuration file passed to it on the command line. The default TC-Pairs configuration file may be found in the data/config/TCPairsConfig_default file.
The configurable items for TC-Pairs are used to specify which data are ingested and how the input data are filtered. The configurable items include specifications for the following:
- All model names to include in matched pairs
- Storms to include in verification: parsed by storm_id, basin, storm_name, cyclone
- Date/Time/Space restrictions: initialization time, valid time, lead time, masking
- User defined consensus forecasts
- Thresholds over watch/warning status of storm
The first step is to set-up the configuration file. Keep in mind, TC-Pairs should be run with the largest desired sample in mind to minimize re-running this tool! First, make a copy of the default:
Next, open up the TCPairsConfig_tutorial_run file for editing and modify it as follows:
basin = [ "AL" ];
To identify the models that we want to verify, as well as the basin. The three models identified are all U.S. operational models: HWRF, GFS (AVNO), and GFDL. Any field left blank will assume no restrictions.
{
name = "CONS";
members = [ "HWRF", "AVNO", "GFDL" ];
required = [ false, false, false ];
min_req = 2;
}
];
To compute a user defined consensus named "CONS". The membership of the consensus are the three listed models, none are required, but 2 must be present to calculate the consensus.
To only keep pairs that are the intersection of the model forecast and observation.
Next, save the TCPairsConfig_tutorial_run file and exit the text editor.
This run uses the default distance to land output file. Run ncview to see it:
Water points have distance to land values greater than 0 while land points have distances <= 0.
Run
Run
TC-Pairs Tool: Run
Next, run TC-Pairs to compare all three ATCF forecast models specified in configuration file to the ATCF format best track analysis. Run the following command line:
-adeck ${METPLUS_DATA}/met_test/atcf_data/aal*dat \
-bdeck ${METPLUS_DATA}/met_test/atcf_data/bal*dat \
-config TCPairsConfig_tutorial_run \
-out tc_pairs \
-v 2
TC-Pairs is now grabbing the model data we requested in the configuration file, generating the consensus, and performing the additional filtering criteria. It should take approximate 20 seconds to run. You should see several status messages printed to the screen to indicate progress.
There should be an output file "tc_pairs.tcst" in the directory, where .tcst stands for TC statistics. The next page will describe what is in the file.
Output
Output
TC-Pairs Tool: Output
The output of TC-Pairs is an ASCII file containing matched pairs for each of the models requested. In this example, the output is written to the tc_pairs.tcst file as we requested on the command line. This output file is in TCST format, which is similar to the STAT output from the Point-Stat and Grid-Stat tools. For more header information on the TCST format, see the tc_pairs output section of the MET User's Guide.
- In the kwrite editor, select Settings->Configure Editor, de-select Dynamic Word Wrap and click OK.
- In the vi editor, type the command :set nowrap. To set this as the default behavior, run the following command:
Open tc_pairs.tcst
- Notice this is a simple ASCII file with rows for each matched pair for a single valid time and similar to the MPR line type written by other tools.
- Any field that has A in the column name (such as AMAX_WIND, ALAT) indicate the model forecast.
- Any field that has B in the column name (such as BMAX_WIND, BLAT) indicate the observation field (Best Track).
- The TK_ERR, X_ERR, Y_ERR, ALTK_ERR, CRTK_ERR columns are calculated track error, X component position error, Y component postion error, along track error, and cross track error, respectively.
- Columns 34-63 are the 34-, 50-, and 64-kt wind radii for each quadrant.
MET Tool: TC-Stat
MET Tool: TC-Stat
TC-Stat Tool: General
TC-Stat Functionality
The TC-Stat tool reads the .tcst output file(s) of the TC-Pairs tool. This tools provides the ability to further filter the TCST output files as well as summarize the statistical information. The TC-Stat tool reads .tcst files and runs one or more analysis jobs on the data. TC-Stat can be run by specifying a single job on the command line or multiple jobs using a configuration file. The TC-Stat tool is very similar to the Stat-Analysis tool. The two analysis job types are summarized below:
- The filter job simply filters out lines from one or more TCST files that meet the filtering options specified.
- The summary job operates on one column of data from TCST file. It produces summary information for that column of data: mean, standard deviation, min, max, and the 10th, 25th, 50th, 75th, and 90th percentiles, independence time, and frequency of superior performance.
- The rirw job identifies rapid intensification or weakening events in the forecast and analysis tracks and applies categorical verification methods.
- The probrirw job applies probabilistic verification methods to evaluate probability of rapid inensification forecasts found in edeck's.
TC-Stat Usage
View the usage statement for TC-Stat by simply typing the following:
| Usage: tc_stat | ||
| -lookin path | TCST file or top-level directory containing TCST files (where TC-Pairs output resides). It allows the use of wildcards (at least one tcst file is required). | |
| [-out file] | Output path or specific filename to which output should be written rather than the screen (optional). | |
| [-log file] | Outputs log messages to the specified file | |
| [-v level] | Level of logging | |
| [-config config_file] | [JOB COMMAND LINE] (Note: "|" means "or") | ||
| [-config config_file] | TCStat config file containing TC-Stat jobs to be run. | |
| [JOB COMMAND LINE] | Arguments necessary to perform a TC-Stat job. |
At a minimum, you must specify at least one directory or file in which to find TCST data (using the -lookin path command line option) and either a configuration file (using the -config config_file command line option) or a job command on the command line.
Configure
Configure
TC-Stat Tool: Configure
Start by making an output directory for TC-Stat and changing directories:
cd ${METPLUS_TUTORIAL_DIR}/output/met_output/tc_stat
The behavior of TC-Stat is controlled by the contents of the configuration file or the job command passed to it on the command line. The default TC-Stat configuration may be found in the data/config/TCStatConfig_default file. Make a copy of the default configuration file and make following modifications:
Open up the TCStatConfig_tutorial file for editing with your preferred text editor.
bmodel = [ "BEST" ];
event_equal = TRUE;
To only parse over two of the three model names in the tc_pairs.tcst file. The event_equal=TRUE flag will keep pairs for specified forecast valid and lead times that are only in both HWRF and GFDL pairs.
Many of the filter options are left blank, indicating TC-Stat should parse over all available fields. You will notice many more available filter options beyond what was available with the TCPairsConfig.
This will create a job that filters out TCST lines based on the job's criteria (this example has no criteria listed, so all TCST lines will be used) and place them into the file indicated by -dump_row.
Run on TC-Pairs output
Run on TC-Pairs output
TC-Stat: Run on TC-Pairs output
Run the TC-Stat using the following command:
-lookin ../tc_pairs/tc_pairs.tcst \
-config TCStatConfig_tutorial -v 3
Open the output file tc_stat.tcst. We can see that this filter job simply event equalized the two models specified in amodel.
Let's try to filter further, this time using the command line rather than the configuration file:
-job filter -lookin ../tc_pairs/tc_pairs.tcst \
-dump_row tc_stat2.tcst \
-water_only TRUE \
-column_str LEVEL HU,TS,TD,SS,SD \
-event_equal TRUE \
-match_points TRUE -v 3
Here, we ran a filter job at the command line: only keeping tracks over water (not encountering land) and with categories Hurricane (HU), Tropical Storm (TS), Tropical Depression (TD), Subtropical Storm (SS), and Subtropical Depression (SD).
Open the output file tc_stat2.tcst: notice fewer lines have been kept. Look at the "LEVEL" column ... note all the non-tropical and subtropical level classifications have been filtered out of the sample.
Also, find the columns ADLAND and BDLAND. All these values are now positive, meaning the tracks over land (negative values) have been filtered.
With the filtering jobs mastered, lets give the second type of job - summary jobs - a try!
Run on TC-Pairs output
Run on TC-Pairs output
TC-Stat: Run on TC-Pairs output
Now, we will run a summary job using TC-Stat on the command line using the following command:
-job summary -lookin ../tc_pairs/tc_pairs.tcst \
-amodel HWRF,GFDL \
-by LEAD,AMODEL \
-column TK_ERR \
-event_equal TRUE \
-out tc_stat_summary.tcst
Open up the file tc_stat_summary.tcst. Notice this output is much different from the filter jobs.
The track data is event equalized for the HWRF and GFDL models, and summary statistics are produced for the TK_ERR column for each model by lead time.
Plotting with R
Plotting with R
TC-Stat: Plotting with R
In this section, you will use the R statistics software package to produce a plot of a few results. R was introduced in practical session 1.
The MET release includes a number of plotting tools for TC graphics. All of the Rscripts are included with the MET distribution in the Rscripts directory. The script for TC graphics is plot_tcmpr.R, which uses the TCST output files from TC-Pairs as input. At this time, there are two additional environment variables that need to be set to make this work. They are MET_INSTALL_DIR and MET_BASE. To get the usage statement, type:
For Bash:
export MET_BASE=${MET_INSTALL_DIR}/share/met
Rscript ${MET_BASE}/Rscripts/plot_tcmpr.R
For C-shell:
setenv MET_BASE ${MET_INSTALL_DIR}/share/met
Rscript ${MET_BASE}/Rscripts/plot_tcmpr.R
The TC-Stat tool can be called from the Rscript to do additional filter jobs on the TCST output from TC-Pairs. This can be done on the command line by calling a filter job (following tc-stat), or a configuraton file can be used to select filtering criteria. A default configuration file can be found in Rscripts/include/plot_tcmpr_config_default.R.
The configuration file also includes various plot types to generate: MEAN, MEDIAN, SCATTER, REFPERF, BOXPLOT, and RANK. All of the plot commands can be called on the command line as well as with the configuration file. Plots are configurable (title, colors, axis labels, etc) either by modifying the configuration file or setting options on the command line. To run from the command line:
-lookin ../tc_pairs/tc_pairs.tcst \
-filter "-amodel HWRF,CONS" \
-dep "TK_ERR" \
-series AMODEL HWRF,CONS \
-plot MEAN,BOXPLOT,RANK \
-outdir .
This plots the track error for two models: HWRF and CONS. CONS is the user defined consensus you generated in TC-Pairs.
Next, open up the output *png files:
display TK_ERR_mean.png &
display TK_ERR_rank.png &
The script produces the three plot types called in the configuration file:
- Boxplot showing distribution of errors for a homogeneous sample of the two models (TK_ERR_boxplot.png).
- Mean Errors with 95% CI for the same sample (TK_ERR_mean.png).
- Rank plot indicating performance of HWRF model relative to CONS (TK_ERR_rank.png).
METplus Use Case: TC-Pairs
METplus Use Case: TC-Pairs
The TCPairs use case utilizes the MET TC-Pairs tool.
Optional: Refer to the MET Users Guide for a description of the MET tools used in this use case.
Optional: Refer to the METplus Config Glossary section of the METplus Users Guide for a reference to METplus variables used in this use case.
There is an example of using TC-Pairs to match Extratropical Cyclones as well as Tropical Cyclones
TCPairs_tropical.conf
MODEL = MYNN, H19C, H19M, CTRL, MYGF
TC_PAIRS_CYCLONE = 06
TC_PAIRS_ADECK_INPUT_DIR = {INPUT_BASE}/met_test/new/hwrf/adeck
TC_PAIRS_OUTPUT_DIR = {OUTPUT_BASE}/tc_pairs
TC_PAIRS_ADECK_TEMPLATE = {model?fmt=%s}/*{cyclone?fmt=%s}l.{date?fmt=%Y%m%d%H}.trak.hwrf.atcfunix
Let's take a look at the data to understand why the configuration file is set up the way it is. If you recall, the {INPUT_BASE} is set in tutorial.conf as ${METPLUS_DATA}, so we will look there:
The output from this command will return four separate directories, each with their own collection of track files. Those four directories are:
H19C
H19M
MYNN
An example of the track files found in each of these directories is:
${METPLUS_BUILD_BASE}/parm/use_cases/met_tool_wrapper/TCPairs/TCPairs_tropical.conf \
${METPLUS_TUTORIAL_DIR}/tutorial.conf \
config.OUTPUT_BASE=${METPLUS_TUTORIAL_DIR}/output/TCPairs
Let's look at the output file:
vi ${METPLUS_TUTORIAL_DIR}/output/TCPairs/tc_pairs/tc_pairs_al2018083012.dat.tcst
vi ${METPLUS_TUTORIAL_DIR}/output/TCPairs/tc_pairs/tc_pairs_al2018083018.dat.tcst
You will notice that there are two models configurations included in the first file for Hurricane Florence, CTRL and MYNN and the line type written out is TCMPR indicate it is the matched pair information. If you open up the third file, you'll notice that there is only the CTRL model listed.
less ${METPLUS_DATA}/met_test/new/hwrf/adeck/H19C/six06l.2018083018.trak.hwrf.atcfunix
less ${METPLUS_DATA}/met_test/new/hwrf/adeck/H19M/six06l.2018083012.trak.hwrf.atcfunix
less ${METPLUS_DATA}/met_test/new/hwrf/adeck/MYNN/six06l.2018083018.trak.hwrf.atcfunix
You will see that in the files are in the ATCF file format. Also note: in the files in the CTRL directory, the model listed in the 5th column is HLAT. Similarly, in the H19C directory, the model is CTRL; in the H19M directory it is MYNN, and in the MYNN directory, it is HLMY. While this is confusing in some ways, it does demonstrate that the TC-Pairs tool does not look at the directory structure and naming convention of the input files, but rather the model information included in the ATCF "a-decks", which is traditional naming convention for files with forecast tracks.
${METPLUS_TUTORIAL_DIR}/user_config/TCPairs_run2.conf
The TC_PAIRS_ADECK_TEMPLATE includes MODEL in the path, so we will leave MYNN and CTRL in the list.
${METPLUS_TUTORIAL_DIR}/user_config/TCPairs_run2.conf \
${METPLUS_TUTORIAL_DIR}/tutorial.conf \
config.OUTPUT_BASE=${METPLUS_TUTORIAL_DIR}/output/TCPairs_run2
Review output
vi ${METPLUS_TUTORIAL_DIR}/output/TCPairs_run2/tc_pairs/tc_pairs_al2018083012.dat.tcst
vi ${METPLUS_TUTORIAL_DIR}/output/TCPairs_run2/tc_pairs/tc_pairs_al2018083018.dat.tcst
You will notice that now all models are included in the appropriate files. Also note that all of the forecasts leads from 000000 to 1260000 are included in the 10th column.
METplus Use Case: TC-Stat
METplus Use Case: TC-Stat
The TCPairs use case utilizes the MET TC-Pairs tool.
Optional: Refer to the MET Users Guide for a description of the MET tools used in this use case.
Optional: Refer to the METplus Config Glossary section of the METplus Users Guide for a reference to METplus variables used in this use case.
Change to the ${METPLUS_TUTORIAL_DIR}
- See what TCPairs use cases are available in met_tool_wrapper directory and run one
There is an example of using TC-Stat with no delineation between Extratropical Cyclones as well as Tropical Cyclones
TC_STAT_JOB_ARGS = -job summary -line_type TCMPR -column 'ASPEED' -dump_row {TC_STAT_OUTPUT_DIR}/tc_stat_summary.tcst
TC_STAT_INIT_BEG = 20150301
TC_STAT_INIT_END = 20150304
TC_STAT_LANDFALL_BEG = -24
TC_STAT_LANDFALL_END = 00
TC_STAT_LOOKIN_DIR = {INPUT_BASE}/met_test/tc_pairs
This use case is focused on summarizing the ASPEED data including data from 24 hours before landfall. Keep in mind the summary information will be written out. Also, because the -dump_row flag was set, output will be placed in the file {TC_STAT_OUTPUT_DIR}/tc_stat_summary.tcst
- Run the use case:
${METPLUS_BUILD_BASE}/parm/use_cases/met_tool_wrapper/TCStat/TCStat.conf \
${METPLUS_TUTORIAL_DIR}/tutorial.conf \
config.OUTPUT_BASE=${METPLUS_TUTORIAL_DIR}/output/TCStat
-
Review the output and input files:
Look at the output written to the directory specified as TC_STAT_OUT_DIR
You will notice this looks very similar to output from TCPairs, confirmed by noting the LINE_TYPE is TCMPR. While this is helpful, the outcome of the SUMMARY job is part of standard output from the tool, unless the -out flag is used when calling the tool. Standard output will be found in the location specified by the TC_STAT_OUTPUT_TEMPLATE. For this example, the file will be named job.out
Open the standard output file in ${METPLUS_TUTORIAL_DIR}/output/TCStat/, with the filename job.out. Inside, you'll find:
SUMMARY: 'ASPEED' 351 0 NA NA NA NA NA NA NA NA NA NA NA NA NA NA NA NA 0 0 0 NA
The headers indicate that this information includes details about the distribution of data as well as measures to generate plots of Frequency of Superior Performance. The description of each column can be found at: https://met.readthedocs.io/en/latest/Users_Guide/index.html. The other notable result is that most columns are listed as NA. This is because the -column setting is listed as 'ASPEED' with quotes around the column name. The quotes appears to be an error, probably a remnant of a previous METplus version. Let's change that and see what happens.
- Copy METplus config file, modify and re-run
${METPLUS_TUTORIAL_DIR}/user_config/TCStat_run2.conf
${METPLUS_TUTORIAL_DIR}/user_config/TCStat_run2.conf \
${METPLUS_TUTORIAL_DIR}/tutorial.conf \
config.OUTPUT_BASE=${METPLUS_TUTORIAL_DIR}/output/TCStat_run2
- Review output
SUMMARY: ASPEED 351 351 -12.04558 -44.41459 20.32342 309.41037 -860 -384 -242 -95 226 377 886 468 1746 -4228 NA NA 0 0 0 NA
SUMMARY: TK_ERR 351 351 42.82123 37.93854 47.70392 46.67289 0 0 11.16231 27.10901 61.31199 97.229 370.00025 50.14968 370.00025 15030.25036 NA NA 0 0 0 NA
The values of ASPEED and TK_ERR are now available. Let's take one more step to demonstrate additional capability.
- Copy METplus config file, modify and re-run
${METPLUS_TUTORIAL_DIR}/user_config/TCStat_run3.conf
${METPLUS_TUTORIAL_DIR}/user_config/TCStat_run3.conf \
${METPLUS_TUTORIAL_DIR}/tutorial.conf \
config.OUTPUT_BASE=${METPLUS_TUTORIAL_DIR}/output/TCStat_run3
- Review output
Open standard output file in ${METPLUS_TUTORIAL_DIR}/output/TCStat_run3 under the name job.out and scroll down to the bottom.
SUMMARY: AMAX_WIND -109 8 8 26.75 24.66593 28.83407 2.49285 23 24.4 25.75 26 28.25 29.6 31 2.5 8 214 060000 054200 0 0 0 NA
SUMMARY: AMAX_WIND -118 3 3 36.33333 24.07937 48.58729 4.93288 33 33.2 33.5 34 38 40.4 42 4.5 9 109 060000 070000 0 0 0 NA
SUMMARY: AMAX_WIND -119 24 24 35.125 32.55402 37.69598 6.08857 24 25.6 30.75 36.5 39.25 42 45 8.5 21 843 NA NA 0 0 0 NA
...
SUMMARY: AMAX_WIND 79 15 15 18.13333 16.37131 19.89535 3.18179 14 15 15.5 17 20 22.8 24 4.5 10 272 NA NA 0 0 0 NA
SUMMARY: AMAX_WIND 83 8 8 20.5 18.82796 22.17204 2 19 19 19 19.5 21.5 23.3 24 2.5 5 164 060000 070730 0 0 0 NA
...
SUMMARY: TK_ERR 51 9 9 19.98849 6.43677 33.54021 17.63013 0 2.5649 6.71828 18.23421 21.86675 47.58604 49.27937 15.14847 49.27937 179.89644 060000 100000 0 0 0 NA
SUMMARY: TK_ERR 54 32 32 29.61144 19.00544 40.21744 30.61107 0 0.31881 8.17406 19.52752 42.21794 80.32842 111.04562 34.04387 111.04562 947.56606 NA NA 0 0 0 NA
There are now 48 lines with lines summarizing AMAX_WIND and TK_ERR across 24 STORM_NAMEs. The information for FSP columns is zero because there is only data for 1 model being summarized.
METplus Use Case: Track and Intensity Plotting
METplus Use Case: Track and Intensity Plotting
METplus Use Case: Track and Intensity TCMPR (Tropical Cyclone Matched Pair) Plotter
This is a wrapper to the MET plot_tcmpr.R, based on R-project Statistical package Rscript. This Rscript will be deprecated in a future METplus release.
Review: Take a look at the following settings.
The default image resolution for the plot_tcmpr.R Rscript is set to 300, for print quality, but quite large for display purposes. The following is an R config file that is passed to the Rscript and changes the default and reduces the image size. It is a simple one line file, but go and take a look.
The plot_tcmpr.R script knows to read this TCMPRPlotterConfig_Customize R config file since it is defined in the TCMPRPlotter.conf file.
Note: If you modify the TCMPR_PLOTTER_CONFIG_FILE variable and leave it undefined (not set), then no configuration file will be read by the R script and the default setting of img_res=300 will be used.
TCMPR_DATA - the path to the input data, in this example, we are using the data in the TC_PAIRS_DIR directory.
MODEL_DATA_DIR - path to the METplus input data.
TRACK_DATA_DIR - path to the METplus input data.
Optional, Refer to the TC-Stat tool example section of the MET Users Guide for a description of plot_tcmpr.R
If you wish, refer to the Format Information for TCMPR output line type table, for a tabular description of the TC-Pairs output TCST format. After running this Track and Intensity example, you can view the TC-Pairs TCST output files generate by this example under your ${METPLUS_TUTORIAL_DIR}/output/track_and_intensity/tc_pairs directory while comparing to the information in the table.
The tcmpr defaults are used for any conf settings left as, unset, For example as: XLAB =
The current settings in the conf files are ok and no changes are required. However, after running the exercise feel free to experiment with these settings.
The R script that Track and Intensity runs is located in the MET installation; share/met/Rscripts/plot_tcmpr.R. The usage statement with a short description of the options for plot_tcmpr.R can be obtained by typing:
with no additional arguments. The usage statement can be helpful when setting some of the option in METplus, below is a description of these settings.
- CONFIG_FILE is a plotting configuration file
- PREFIX is the output file name prefix.
- TITLE overrides the default plot title. Bug: CAN_NOT_HAVE_SPACES
- SUBTITLE overrides the default plot subtitle.
- XLAB overrides the default plot x-axis label.
- YLAB overrides the default plot y-axis label.
- XLIM is the min,max bounds for plotting the X-axis.
- YLIM is the min,max bounds for plotting the Y-axis.
- FILTER is a list of filtering options for the tc_stat tool.
- FILTERED_TCST_DATA_FILE is a tcst data file to be used instead of running the tc_stat tool.
- DEP_VARS is a comma-separated list of dependent variable columns to plot.
- SCATTER_X is a comma-separated list of x-axis variable columns to plot.
- SCATTER_Y is a comma-separated list of y-axis variable columns to plot.
- SKILL_REF is the identifier for the skill score reference.
- LEGEND is a comma-separted list of strings to be used in the legend.
- LEAD is a comma-separted list of lead times (h) to be plotted.
- RP_DIFF is a comma-separated list of thresholds to specify meaningful differences for the relative performance plot.
- DEMO_YR is the demo year
- HFIP_BASELINE is a string indicating whether to add the HFIP baseline and which version (no, 0, 5, 10 year goal)
- FOOTNOTE_FLAG to disable footnote (date).
- PLOT_CONFIG_OPTS to read model-specific plotting options from a configuration file.
- SAVE_DATA to save the filtered track data to a file instead of deleting it.
- PLOT_TYPES is a comma-separated list of plot types to create:
- BOXPLOT, POINT, MEAN, MEDIAN, RELPERF, RANK, SKILL_MN, SKILL_MD
- for this example, set to MEAN,MEDIAN to generate MEAN and MEDIAN plots.
- SERIES is the column whose unique values define the series on the plot, optionally followed by a comma-separated list of values, including:
ALL, OTHER, and colon-separated groups. - SERIES_CI is a list of true/false for confidence intervals. Optionally followed by a comma-separated list of values, including:
ALL, OTHER, and colon-separated groups.
Run METplus: Run Track and Intensity use case.
Examples: Run the track and intensity plotting script
Generates plots using the MET plot_tcmpr.R Rscript.
Example 1:
In this case, the TCMPRPlotter.conf file is configured to generate MEAN and MEDIAN plot types with TCMPR_PLOTTER_PLOT_TYPES.
Run the following command:
${METPLUS_BUILD_BASE}/parm/use_cases/met_tool_wrapper/TCMPRPlotter/TCMPRPlotter.conf \
${METPLUS_TUTORIAL_DIR}/tutorial.conf \
config.OUTPUT_BASE=${METPLUS_TUTORIAL_DIR}/output/track_and_intensity
The following directory lists the files generated from running these use cases:
AMAX_WIND-BMAX_WIND_boxplot.png
AMAX_WIND-BMAX_WIND_mean.png
AMAX_WIND-BMAX_WIND_median.png
AMSLP-BMSLP_mean.png
AMSLP-BMSLP_median.png
TK_ERR_mean.png
TK_ERR_median.png
Example 2:
Copy the TCMPRPlotter.conf file to the user_config directory:
${METPLUS_TUTORIAL_DIR}/user_config/TCMPRPlotter_boxplot.conf
Open the new conf file with an editor and change the list of plot types to only include BOXPLOT.
Change this line (around line 65):
to
Close the file and rerun METplus:
${METPLUS_TUTORIAL_DIR}/user_config/TCMPRPlotter_boxplot.conf \
${METPLUS_TUTORIAL_DIR}/tutorial.conf \
config.OUTPUT_BASE=${METPLUS_TUTORIAL_DIR}/output/track_and_intensity_boxplot
The following directory lists the additional files generated from running this use case:
AMAX_WIND-BMAX_WIND_boxplot.png
AMSLP-BMSLP_boxplot.log
AMSLP-BMSLP_boxplot.png
TK_ERR_boxplot.log
TK_ERR_boxplot.png
To view the png images generated by running these examples, use the display command.
cd to your OUTPUT_BASE/tcmpr_plots directory.
display AMAX_WIND-BMAX_WIND_mean.png &
display AMAX_WIND-BMAX_WIND_median.png &
display AMAX_WIND-BMAX_WIND_boxplot.png> &
End of Session 6
End of Session 6
End of Session 6
Congratulations! You have completed Session 6!