Transitions Newsletter Header

Issue 36 | Winter 2024

Lead Story

An opportunity to grow the UFS community and the RRFS

Contributed by Jacob Carley - NOAA Federal, Curtis Alexander - NOAA Affiliate, and Louis Wicker - NOAA Federal

The Rapid Refresh Forecast System (RRFS) is NOAA’s next-generation high-resolution, rapidly- updating ensemble prediction system that is underpinned by the Finite Volume Cubed Sphere (FV3) dynamical core of the Unified Forecast System (UFS). The RRFS has been in development over the past 5-7 years as part of a major collaborative effort between numerous organizations in NOAA, an ongoing partnership with the DTC, and academia.

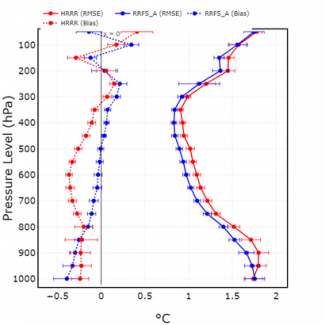
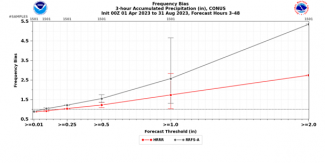
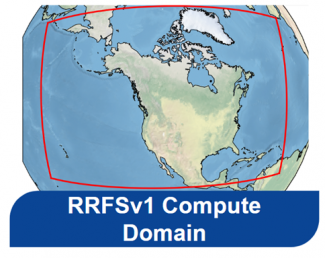
The RRFS must meet or exceed the performance of the current operational high-resolution deterministic and ensemble systems. Accordingly, the RRFS features many ambitious capabilities that set it apart from the present era of high-resolution Numerical Weather Prediction (NWP) systems, such as a large 3-km domain covering all of North America (Fig. 1). So far, its overall performance has been quantitatively promising in the cool season (Fig. 2), but the same cannot be said for warm-season convective precipitation. In these scenarios, the RRFS tends to produce storms that are too intense and have a high bias in precipitation (Fig. 3).

Figure 1. The 3-km North American computational domain for RRFS.
Figure 2. Bias (dotted) and RMSE (solid) of 24-h forecast of upper air temperature over the period December 2022-February 2023 comparing the operational HRRR (red) to RRFS (blue).
Figure 3. Frequency bias by precipitation threshold comparing HRRR (red) and RRFS-A (gray) for 3-h accumulation intervals for a 48-h forecast period from 1 April to 31 August 2023. Figure taken from Carley et al. (2024, https://doi.org/10.25923/ccgj-7140).

In the Spring and Summer 2023, the NOAA National Severe Storms Laboratory (NSSL) ran several versions of the Model for Prediction Across Scales, or MPAS, using configurations similar to RRFS. The results were impressive, with performance exceeding that of the RRFS for key convective forecast fields. In light of these results, and the continued struggles to improve RRFS performance for convective prediction, NOAA leadership requested a study be performed to review the efforts to address the challenge in the RRFS and recommend a path forward (https://doi.org/10.25923/ccgj-7140).

As a part of this study, a large number of homogeneous and idealized convective simulations were conducted to identify the source of the RRFS bias. FV31 solutions were compared to solutions from well-known convective models, Cloud Model 1 (CM1), and the Advanced Weather Research and Forecast Model (WRF-ARW). CM12 and WRF-ARW were modified to resemble the FV3 configuration as closely as possible. The FV3 was set up to use RRFS settings, and all models used the “Kessler” microphysics scheme.

In the Spring and Summer 2023, the NOAA National Severe Storms Laboratory (NSSL) ran several versions of the Model for Prediction Across Scales, or MPAS, using configurations similar to RRFS. The results were impressive, with performance exceeding that of the RRFS for key convective forecast fields.

The results shown are from an environment similar to the southeast U.S. summertime environment (moderate Convective Available Potential Energy [CAPE] and low vertical shear). Figure 4 displays the squall-line solutions after 5 hours.  The two most noticeable features are the differences in cold pool size (related to the amount of precipitation that evaporates) and the size of the color-filled “updraft objects” (see caption for object criteria). The FV3 solution shows a broader cold pool with larger storm objects than CM1 (ARW not shown).  Even with a homogenous environment and very simple microphysics, kernel density estimates (Fig. 4, far right panel) from the accumulated rainfall at each grid point show that FV3 produces many more points with moderate to heavy rainfall above 50 mm. This behavior is very consistent with the full physics NWP results.  It strongly suggests that the dynamical core in FV3 is behaving in a fundamentally different manner than CM1 or WRF.  FV3’s uses a “D” grid staggering, which has ~½ the resolution of the “C” grid staggering used in CM1, WRF, and MPAS. This likely results in larger storms and excessive rainfall. Unfortunately, the fundamental grid discretization of a model is a core design component that is not straightforward to change.

Figure 4: (a) Horizontal cross-sections from squall line at 5 hours. The gray-shaded regions are the cold pool (perturbation theta less than -1 K) and the solid-colored regions indicate storm objects identified as regions where the composite reflectivity > 35 dBZ and vertical velocity
above 700 mb is at least 2 m/s. (b) Kernel density estimates of the accumulated precipitation over the 6-h period from the squall lines using the three models (low-shear, moderate CAPE). Figure taken from Carley et al. (2024, https://doi.org/10.25923/ccgj-7140)

With the source of the convective storm bias identified and promising results of MPAS in-hand, the study recommends that version 2 of RRFS should transition to the MPAS dynamical core. MPAS features a more favorable C-grid staggering for RRFS applications, has a limited area capability, and presents an exciting opportunity to grow the UFS community.

[1] We employed FV3 SOLO for these simulations. FV3 SOLO is GFDL’s simplified version of the dynamical core.  SOLO’s dynamical core is nearly identical to the RRFS model.

[2] “Cloud Model-1” (CM1) is a numerical model for idealized studies and is considered the standard for convective storm research models.  It has been cited in more than 350 peer-reviewed published articles in the last decade in 30 different journals.


Director's Corner

How the DTC has helped build a modeling community

Contributed by Brian Gross, Director EMC

As I near the end of my 31+ year career with NOAA, this is a wonderful (and timely) opportunity to reflect on the last (almost) 6 years of model development and DTC engagement. The last time I provided my perspective for a Director’s Corner was during the Summer of 2018. At that time, I had recently joined NOAA’s National Weather Service (NWS) and was excited at the prospect of moving toward community-based model development to enhance NWS’ operational numerical weather prediction (NWP) systems. The DTC has played an essential role in that development community, and we would not be where we are today without their dedication, skill, and attention to model improvement. I also had the privilege of chairing the DTC’s Executive Committee, which gave me a chance to develop relationships with my colleagues at NOAA’s Global Systems Laboratory in the Office of Oceanic and Atmospheric Research (OAR), the US Air Force, and at NCAR.

The DTC has played an essential role in that development community, and we would not be where we are today without their dedication, skill, and attention to model improvement.

When I arrived, the DTC was already well on its way to supporting community collaboration through its numerous activities.They understood the challenge of creating a single modeling system (quite distinct from a single model!) that served the needs of both the research and operational communities. Leveraging their existing relationships with the model development community, the DTC focused on supporting the development of a UFS-based Convective-Allowing Model (CAM) out of the gate, as well as establishing a longer-term vision for support across all UFS applications. They also anticipated the need to use computing resources in the cloud, developing containers for a number of applications.

Over the last few years, the DTC has been able to shift its focus more (but not totally!) toward testing and evaluation. I think this is one of the most important elements in a successful community modeling enterprise. Perhaps the DTC activity I quote most frequently is the 2021 UFS Metrics Workshop. The DTC led the community in developing a set of agreed-to metrics across the UFS applications, verification datasets, and gaps. The community they engaged was large, including NOAA (both research labs and operational offices), NASA, NCAR, DoD, and DoE. To bring all of these organizations together was an immense achievement in my book, and the output from the workshop will be used for years to come.

One important facet of unifying around a common set of metrics is finding a common way to calculate them when evaluating model output. The DTC has been a leader in the development and release of the METplus suite of evaluation tools. At EMC, we have based the EMC Verification System (EVS) on the DTC’s METplus work, producing the first ever unified system for quantifying performance across all of NOAA’s operational NWP systems, measuring the forecast accuracy of short-term, high-impact weather and ocean-wave forecasts to long-term climate forecasts. The information will help quantify model performance with much more data than previously available, in a single location.

Atmospheric physics is at the heart of the performance of NWP systems and drives some of the most critical forecast parameters we deliver. The DTC develops, manages, and provides the Common Community Physics Package (CCPP) to simplify the application of a variety of physical parameterizations to NWP systems. The CCPP Framework, along with a library of physics packages that can be used within that framework, takes the concept and flexibility of framework based modeling systems and applies it to the milieu of possible physics algorithms. This has become an essential part of EMC’s development of operational NWP systems. Indeed, the first operational implementation of the CCPP in an operational environment was with the new UFS-based Hurricane and Analysis Forecast System, which became operational in June 2023.

I am extraordinarily grateful for my years-long association with the DTC. Their leadership in establishing a community-modeling paradigm with the UFS has been extraordinary, and the future of NWP across the enterprise looks quite bright because of what the DTC does. Thank you!


Brian Gross, Director of EMC


Who's Who

Eric Gilleland

Eric Gilleland is a Project Scientist II with the Joint Numerical Testbed (JNT) at NSF NCAR. He lends his expertise to applying statistical methodology to a wide array of applications. In particular, he identifies trends in meteorological quantities within a climate context, designing new methods for comparing large spatial fields such as high-resolution weather forecast verification, and extensive work in extreme-value analysis. Eric also manages the highly successful DTC Visitor Program. 

Eric is a bit of a unicorn being born and raised in Boulder, CO. As a child, he loved sports, especially basketball and anything that required running. He started weightlifting when he was 14, using the YMCA gym because they allowed kids under 18. Heavy metal was the soundtrack for his teenage years. As for school, he preferred math because he liked to “figure things out.”  He majored in mathematics at the University of Colorado (CU Boulder), though it was more abstract than he bargained for, but he stuck with it anyway. As an undergrad, he tutored math for the CU athletic department, which was exciting because CU’s football team was one of the top five in the nation. 

As is the case for many, his career path was anything but linear. His original plan was to teach high school math, but he changed course and went to graduate school at Arizona State University (ASU) to become an actuary and eventually discovered statistics. Eric switched majors and earned a Masters in statistics from ASU, and earned a Ph.D. from the world-class statistics program at Colorado State University (CSU).  

During the summer before starting graduate studies at CSU, Eric worked for the US West phone company and nearly did not go back to school. But, he quit when workers went on strike because he didn’t want to cross the picket line, and returned to CSU. During that year, he worked multiple jobs to pay for school.  Eventually he was offered a graduate research position at NSF NCAR with the statistics group called the Geophysical Statistics Project (GSP) led at the time by Doug Nychka.  Doug was an adjunct faculty at CSU and he served as Eric’s Ph.D. advisor.  Before finishing his Ph.D., Eric accepted an Associate Scientist II position working with Barb Brown in the Research Applications Lab (RAL). He finished his Ph.D. a couple of years later, focusing on spatial statistics and extreme-value analysis.

One of Eric’s main contributions to the DTC is to advise what elements should be included in MET/METplus, and assist with staff and external collaborators’ statistics questions. One of his favorite topics since joining Barb Brown’s group has been working on spatial forecast verification methods. He also enjoys working on extreme-value analysis applications when he has time. Eric manages the DTC Visitor Program, which draws collaborators from a wide range of organizations and institutions, and is a tremendous asset for the DTC. Eric feels one of the big challenges inherent in working for the organization is obtaining funding, which is a commonly held concern. But collaborating with great people is the best reward.

Eric spends his free time weightlifting and running. He has dabbled in French, and his Spanish wife motivates him to learn Spanish.  He also learned a fair amount of Frisian, a North Sea Germanic language, spoken by about 500,000 people who live in a province called Friesland on the southern fringes of the North Sea in the Netherlands. It was once considered the closest language to English. He discovered this interest as a child but put it aside until adulthood when he could do a deep dive and build his passion for it.

 

Eric Gilleland


Bridges to Operations

Technical Aspects of Generalizing the UFS to use Multiple Dynamical Cores

Contributed by Ligia Bernardet (NOAA GSL and DTC) and Dom Heinzeller (UCAR/JCSDA)

Following the scientific and programmatic discussions surrounding a potential shift of the Rapid Refresh Forecast System (RRFS) toward using the Model for Prediction Across Scales (MPAS) dynamical core (Carley et al. 2024), a Tiger Team was formed to scope out the technical work needed to add a second dynamical core (dycore) to the Unified Forecast System (UFS).  The Tiger Team focused on a two-pronged approach: scope out the inclusion of a generic new dycore in the UFS, and focus the majority of its work on the MPAS dycore. Similarly, since the drive for a new dycore comes from the RRFS team, the Tiger Team kept in mind the use of the MPAS dycore for all UFS Apps, while focusing primarily on the UFS Short Range Weather (SRW) App.

The Tiger Team collected input from UFS App leadership teams and from NSF NCAR. The connection with both NSF NCAR Mesoscale and Microscale Modeling (MMM) and Climate and Global Dynamics (CGD) Laboratories is relevant because MMM develops and uses the MPAS model, while CGD uses the MPAS atmospheric component dycore in the Community Atmospheric Model, the atmospheric component of the Community Earth System Model (CAM/CESM). The solution proposed by the Tiger Team is similar to the one used by CGD. The vision is to use the MPAS dycore in the UFS without using the entire MPAS code available on Github, which comes with additional components such as a driver, a framework, and additional utilities. This arrangement will allow the UFS to retain core parts of its infrastructure, such as its workflow, connection with physics via the Common Community Physics Package (CCPP), Input/Output (I/O) strategy, post-processing capability, and product generation. While this approach is more costly initially, it will save resources in the long run, facilitate community engagement, and smooth out the path for bringing innovations into NOAA operations.

The vision is to use the MPAS dycore in the UFS without using the entire MPAS code available on Github. This way, the UFS will retain core parts of its infrastructure, such as its workflow, connection with physics via the Common Community Physics Package (CCPP), Input/Output (I/O) strategy, post-processing capability, and product generation.

The technical challenges of including the MPAS dycore in the UFS were estimated to be on the order of 13 full-time equivalent employees and can be grouped into the main areas below. Additional resources may be needed to support NSF NCAR for this collaboration and to conduct scientific testing. It should be noted that this level of effort corresponds to the initial integration of the MPAS dycore in the UFS, and does not represent the ongoing overhead of maintaining a dual dycore forecast system.

  • Generalization of the UFS atmospheric component.  Portions of code tie directly to the Finite-Volume Cubed-Sphere (FV3) dynamics, and these portions need to be generalized to support multiple dycores. The build system needs to be modified to accommodate this generalization.
  • Code management and testing. A code management plan needs to be devised jointly with NSF NCAR to manage the insertion and potential updates to the MPAS dycore. New regression tests need to be added to the UFS Weather Model to cover the new dycore.
  • Pre-processing. It will be necessary to integrate already-existing MPAS utilities to prepare initial condition and static files into the UFS. Tools to obtain/create new MPAS meshes will need to be available to the community.
  • Data assimilation. Significant work is needed to connect the Joint Effort for Data assimilation Integration (JEDI) with the UFS Weather Model and with RRFS in particular. That said, given that the JEDI interfaces are model agnostic and that the JEDI-MPAS capability already exists, there is no new cost generated by the dynamical core switch. It is assumed that no efforts will be made to integrate the MPAS dycore with the legacy Gridpoint Statistical Interpolation (GSI) data assimilation system.
  • Physics-dynamics coupling. While the CCPP offers model-agnostic interfaces, the substantial differences in physics dynamics coupling between FV3 and MPAS will demand some adjustments. Those pertain to where in the dycore the physics tendencies should be applied, differences in time-split versus process-split approaches, conversions toward the MPAS height-based coordinates, and to the development of MPAS-specific interstitial schemes. Additional effort will be needed to adapt existing stochastic processes.
  • Inter-component coupling. The MPAS National Unified Operational Prediction Capability (NUOPC) cap existing in CAM/CESM will be leveraged to expose the MPAS dycore geometry and domain decomposition in the cap of the UFS atmospheric component. Aspects of data memory allocation, run sequence, and import/export of fields will need to be addressed.
  • Input/Output and post-processing. Since MPAS outputs data on its native unstructured mesh, additional tools will be needed to convert the output to the desirable lat-lon grids. First, stand-alone tools can be used. Ultimately, to improve performance for operations, the Unified Post-Processor (UPP) and the UFS asynchronous I/O component need to be generalized to write out the desired products.
  • Workflow. The workflow(s) will have to be modified to include the MPAS-specific tasks.

For more information about this effort, readers are referred to Wang et al. (2023).


Visitors

Cloud Overlap Evaluation for HAFS Tropical Cyclone Predictions

Contributed by John M. Henderson and Michael J. Iacono, Verisk - Atmospheric and Environmental Research

During their recent project for the DTC Visitor Program, Michael Iacono and John Henderson of Verisk - Atmospheric and Environmental Research (AER) used the newly operational Hurricane Analysis and Forecasting System (HAFS) to evaluate the impact of an improved method to represent the sub-grid variability and vertical overlap of partial cloudiness in radiative transfer calculations on tropical cyclone predictions. This work was an extended application of their exponential (EXP) cloud overlap advancement that was adopted by NOAA in the 2018 operational Hurricane Weather Research and Forecasting (HWRF) model, and of their exponential-random (ER) method that NOAA adopted in the operational HWRF in 2020.

Understanding the way that clouds absorb, emit, and scatter radiation is essential to modeling their role in Earth’s radiative processes effectively.

Clouds are a critical component of Earth’s climate. They strongly influence both the incoming solar (or shortwave) energy, which fuels the climate system, and the thermal (or longwave) energy that is emitted by the surface and partially escapes to space. Understanding the way that clouds absorb, emit, and scatter radiation is essential to modeling their role in Earth’s radiative processes effectively.

One limitation to simulating clouds and their radiative impact accurately is the challenge of representing their variability on scales smaller than the typical grid spacing of global atmospheric models (~10 km) and regional models such as HAFS (~2 km). Radiative transfer through sub-grid scale clouds depends on whether fractional clouds are vertically correlated, such as in tall thunderstorm clouds, or uncorrelated such as for randomly distributed polar clouds. This radiative process is also dependent on properly simulating cloud fraction and both the physical and optical properties of clouds.

Using the Rapid Radiative Transfer Model for Global Climate Models (RRTMG) radiation code in HAFS, the primary objective of this project was to establish whether any predictive benefit is gained by using EXP or ER. These methods have been shown to be more realistic relative to radar measurements within vertically deep clouds when compared with the older maximum-random (MR) method currently used in HAFS. The MR approach forces the clouds to be more vertically coherent through adjacent partly cloudy layers. EXP and ER relax this restriction by allowing the correlation to transition exponentially from maximum to random with vertical distance through the cloudy layers. A small adjustment is provided by a spatially dependent decorrelation length. ER adds a further randomization between cloudy layers separated by clear sky relative to EXP. The exponential treatments modestly increase total cloudiness and reduce shortwave radiation reaching the surface relative to MR cloud overlap.

Hurricane Idalia track (left), central pressure (center), and maximum wind speed (right) for the observed “best track” values (black) and the HAFS modeled values for a forecast cycle initialized at 12 UTC on 27 August 2023 for the operational HAFS-A (gray) and three forecasts using the near-operational HAFS-A model for three treatments of cloud overlap (MR, blue; EXP, green; and ER, red).

To assess this advancement in HAFS, hurricane predictions were performed by AER with the assistance of the DTC for multiple 2022 and 2023 tropical cyclones using MR, EXP, and ER cloud fraction overlap and a latitude-varying decorrelation length. The figure shows predictions of Hurricane Idalia track (left panel), central pressure (center panel), and maximum wind speed (right panel) for a forecast cycle initialized at 12:00 UTC on 27 August 2023.  Observed “best-track” values are in black, predictions from the real-time operational HAFS-A are in gray, and predictions from a near-operational version of HAFS-A using MR, EXP, and ER cloud overlap are in blue, green, and red, respectively.  Although the operational HAFS-A run also used MR cloud overlap, it applied the warm-start method for vortex initialization, which improved its prediction. The three forecasts performed by AER used cold-start initialization, and therefore are not directly comparable to the operational forecast. Although the track of Idalia was not very sensitive to the overlap method in this case, both measures of Idalia’s intensity show much greater sensitivity to cloud overlap, which suggests some predictive benefit of using the exponential approaches. 

Our interactions with the DTC have been a rewarding opportunity to investigate new directions on this research topic, to work with two operational hurricane models, and to transition critical physics enhancements to NOAA operations. We expect to continue pursuing further research collaborations with the DTC and NOAA/EMC in the future.

John M. Henderson and Michael J. Iacono


Community Connections

Community Use of Common Community Physics Package Single-column Model

Contributed by Weiwei Li

The Common Community Physics Package (CCPP) single-column model (SCM) is developed and supported by the Developmental Testbed Center (DTC). In addition to periodic public releases, the CCPP SCM and its applications were introduced to the community in 2020 through an AMS Short Course “Experimentation and Development of Physical Parameterizations for Numerical Weather Prediction Using a Single-Column Model and the Common Community Physics Package” and a series of workshops and conferences. The DTC has been using the CCPP SCM to facilitate the Unified Forecast System (UFS) physics developments, testing and evaluations, which have been highlighted in previous DTC newsletters. Beyond the numerous applications of the CCPP SCM at the DTC, applications span from physics development, process-level understanding, to participating in model inter-comparison projects (MIPs; Table 1).

For years, the UFS community has vigorously used the CCPP SCM for physics development. In the development of the Grell–Freitas convection scheme, the CCPP SCM simulations demonstrated the value of using beta functions to characterize the features associated with three convection modes. For the scale-aware Turbulent Kinetic Energy eddy-diffusivity mass-flux (TKE-EDMF) scheme, the CCPP SCM helped identify the impact of mixing-length formulations and constraints on parameterizing boundary-layer turbulence (Fig. 1). In addition to conventional column physics, the CCPP SCM was also applied to facilitate process-level investigations on such as the Noah-MP Land Surface Model, the direct radiative effects of aerosols, land-atmosphere interactions, and microphysics in the Arctic systems. The CCPP SCM was also adopted to conduct idealized simulations to examine the impacts of deep convective downdrafts and re-evaporation of convective rain on the tropical mean state and variability.

Besides the UFS, the broad community has started exploring the merits of this tool. Recently, the CCPP SCM has been used as a teaching tool by Professor Cristiana Stan of George Mason University, where graduate students can dive into the complexity of an Earth system model. To support Navy model development, it helped test the implementation of aerosol-radiation interaction for the marine atmospheric boundary layer. The NSF NCAR, through a Department of Energy project, used the CCPP SCM and observations to gain advanced boundary layer understanding and parameterizations that are currently used by multiple host models, including the UFS and the NSF NCAR models. The State University of New York at Albany used it to study shallow convective systems in trades and the direct radiative impact of Saharan dust aerosols on African easterly waves. The tool was also adopted in a few MIPs, including evaluating radiation fog in the Local and Non-local Fog Experiment (LANFEX) field campaign and the Cold-Air Outbreaks in the Marine Boundary Layer Experiment (COMBLE) MIP. This effort will help improve the physical representations of various aspects of mixed-phase cloud systems. 

As the capabilities of the CCPP SCM flourish, it is foreseeable that the tool will facilitate more robust physics developments and scientific investigations, which would ultimately benefit the Earth system modeling community. At the same time, it is worth keeping in mind that users need to fully understand the processes to be examined when using a SCM, given its semi-idealized nature.

Table 1 List of researchers, institutes, and areas with publications/presentations for using the CCPP SCM beyond the DTC.

Researchers

Institutes 

Areas

Saulo Freitas, Georg Grell, and Haiqin Li

NASA & NOAA/GSL

Cumulus physics development for RAP, HRRR and RRFS; Freita et al. (2021)

Edward Strobach

NOAA/EMC

PBL physics development in GFS; Strobach (2022)

Weizhong Zheng, Michael Barlage, and Helin Wei 

NOAA/EMC

Noah-MP Land Surface Model development for the UFS; Zheng et al. (2021)

Anning Cheng and Fanglin Yang

NOAA/EMC

Radiative effects of aerosols in the UFS; Cheng and Yang (2022)

Siwei He

Montana State University 

Land-atmosphere interactions in the UFS; He et al. (2022) 

Amy Solomon 

NOAA/PSL

Microphysics associated with forecast of Arctic systems for the UFS  (personal correspondence)

Sasa Gabersek

NRL

Aerosol-radiation interaction; Gabersek et al. (2024)

I-Kuan Hu

NOAA/PSL

Testing and evaluation of cumulus physics (personal correspondence); Hu et al. (2024)

Lulin Xue and Weiwei Li

NSF NCAR

PBL physics in the UFS and the NCAR models; Xue et al. (2023)

Xia Sun

NOAA/GSL

Evaluating CAPE bias in the UFS; Sun et al. (2023) 

Christian Wilder Barreto-Schuler

Univ. at Albany - SUNY

Direct radiative impact of Saharan dust aerosols on African easterly waves; Barreto-Schuler et al. (2024)

Jian-wen Bao and Evelyn Grell

NOAA/PSL

LANFEX MIP; Boutle et al. (2022)

Weiwei Li and Lulin Xue

NCAR 

COMBLE MIP; Juliano et al. (2022)


Did you know?

EPIC Support is Available

The Earth Prediction Innovation Center (EPIC) provides user support and feature enhancements for select Unified Forecast System (UFS) applications, models, and components. To request new UFS features or enhancements, post a request on the ufs-community GitHub Discussions page under Enhancement. View the posting guidelines for details on what information to include. For requests specific to one of EPIC’s supported repositories, community members can post directly in the Enhancement category for that repository: the Short-Range Weather (SRW) Application, the Land Data Assimilation (DA) System, the UFS Weather Model, and the Unified Post Processor. Any lingering questions? Just email us at support.epic@noaa.gov!