Transitions Newsletter Header

Issue 22 | Summer 2020

Lead Story

UFS Medium-Range Weather Application Launched

Team Depth and Broad Engagement = Success

The community aspect of NOAA’s Unified Forecast System (UFS) is off to a strong start with the release of the UFS Medium-Range Weather Application v1.0 on 11 March 2020.  The planning and preparations for this release were truly a community effort that convened a multi-institutional team of scientists and software engineers from NOAA’s Environmental Modeling Center (EMC), NOAA research laboratories (Global Systems Laboratory [GSL], National Severe Storms Laboratory [NSSL], Physical Sciences Laboratory [PSL], and Geophysical Fluid Dynamics Laboratory [GFDL]), Cooperative Institutes (Cooperative Institute for Research in Environmental Sciences [CIRES] and Cooperative Institute for Research in the Atmosphere [CIRA]), the Developmental Testbed Center (DTC), the National Center for Atmospheric Research (NCAR) and George Mason University (GMU).  This multi-institutional Release Team was assembled in September 2019, and charged with developing a streamlined project plan for the first public release of UFS, and then overseeing and executing this project plan. The aim was to build a well documented UFS modeling system that the community can download, set up, and run in multiple computing environments.  

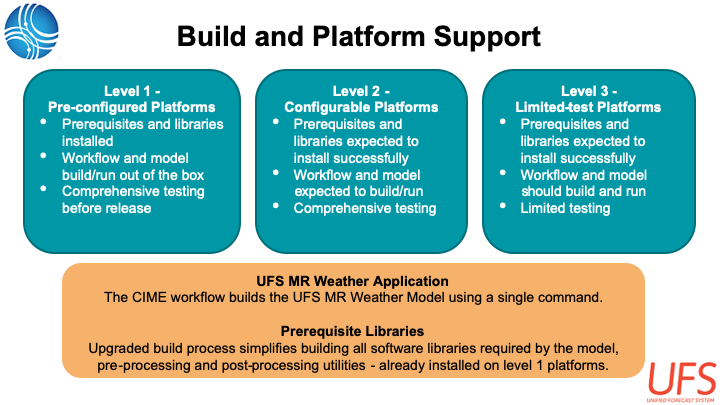
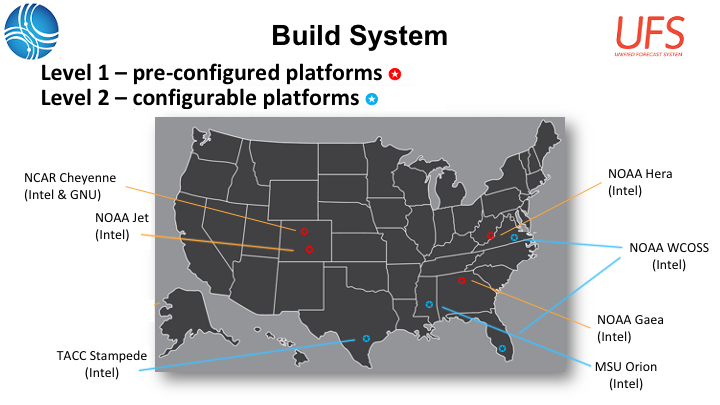
The UFS is undergoing rapid development across multiple fronts to achieve its vision of meeting the needs for applications spanning from local to global domains and predictive time scales from sub-hourly analyses to seasonal predictions; therefore, an important first step was to define the scope of this initial release.  The team quickly converged on a plan that focused on global configurations for four different resolutions and two supported physics suites: the operational GFSv15 suite and an experimental physics suite under development for GFSv16.  To provide the community with some flexibility on which forecast cycles the model could be run, the team decided it would be important to include the capability to initialize the model using more widely available GRIB2 output.  The team also prioritized the portability of this complex software system, testing on multiple platforms, providing a robust, user-friendly workflow, assembling documentation, and establishing a support mechanism.

To address the portability priority, a small team overhauled the build system for the NCEP libraries, an area that has been an ongoing issue since the DTC first started working with EMC to make their operational codes more accessible to the community.  The NCEP libraries are the underpinnings of everything from the model code to the pre- and post-processing software.   Improvements to the build system also included the model itself.  While there’s always room for further improvement, the outcome is a package that is straightforward to build on different computing platforms, as well as using different compilers.  These platforms include NOAA’s research HPC, NCAR’s Cheyenne, and TACC’s Stampede2, as well as generic MacOS and Linux systems.  The team went one step further by establishing pre-configured platforms, which are platforms where all the required libraries for building the UFS community release are available in a central place.

To meet the needs of a robust, user-friendly workflow, the Release Team selected the Common Infrastructure for Modeling the Earth (CIME), a Python-based scripting infrastructure developed through a multi-agency collaboration (NSF, DOE, NOAA).  CIME, which now supports four distinctEarth modeling systems (CESM, E3SM, NORESM, and UFS), provides the user with the ability to create experiments by invoking only four commands.

To establish a solid foundation from which to build upon, and lighten the load for future releases, the team developed version-controlled documentation that is stored with the code and can be continuously updated.  For ease of navigation, the documentation can be displayed electronically and is easily searchable.  Building this framework and assembling all the pieces was a significant undertaking that relied on contributions from a number of subject-matter experts.

With an eye towards engaging the broader community in all aspects of the UFS, the Release Team selected community forums as the best approach for providing user support.  These forums are publicly viewable and users can post new topics and responses to existing topics by becoming registered users.  Bugs and deficiencies in the documentation brought to light by postings to the UFS forums are catalogued and will be addressed in future releases.

The feedback from the community about the UFS MRW Application v1.0 release has been very positive.  Bugs in the code and deficiencies in the documentation brought to light by postings to the UFS forums are being catalogued, as well as feedback collected through the Graduate Student Test set up by the UFS Communications and Outreach Working Group, and work is underway to address these issues through the release of UFS MRW Application v1.1 in the coming months.  In addition, planning and preparations are underway for the release of the Short-Range Weather Application v1.0 later this year, which will provide the community with the capability to run a Stand-Alone Regional configuration of the UFS-Atmosphere model.

More information

AMS Webinar – UFS MRW Application 1.0: https://www.ametsoc.org/index.cfm/ams/webinar-directory/

UFS MRW Application Users Guide:https://ufs-mrweather-app.readthedocs.io/en/ufs-v1.0.0/


Director's Corner

Community Modeling and the Transition from Research to Operations and Operations to Research

Jim Kinter
Contributed by Jim Kinter, George Mason University

This is an exciting era in Earth system prediction research and operational forecasting. Researchers are gaining access to a powerful set of tools that are deployed or soon to be used to produce the nation’s weather forecasts, climate outlooks, and more. Operational forecasters are gaining more direct access to the latest breakthroughs and innovations in modeling and prediction research. Here’s why I am so enthusiastic.

First, an anecdote. When I was studying for the PhD, my advisor, Kikuro Miyakoda, who led our group at the Geophysical Fluid Dynamics Laboratory (GFDL), was developing the “E-physics” experimental subgrid physical parameterization in a global atmospheric model. After a successful demonstration predicting the extreme winter of January 1977 (Miyakoda et al. 1983), the E-physics parameterization transitioned in 1985 from research to operations (R2O) in the Medium Range Forecast (MRF) model at the National Meteorological Center (NMC), thanks to the painstaking collaborative effort by GFDL and NMC scientists. Shortly after joining Shukla’s group at the University of Maryland, they signed an MOU with Bill Bonner and John Brown of NMC to use the MRF for predictability research. With the support of NMC scientists including Joe Gerrity, Joe Sela, Bob Kistler and Glenn White, we ran the model on the NMC computer and then transferred the JCL, Fortran code, and test data on 9-track tape to computers outside NOAA. That transition from operations to research (O2R), without documentation and lots of operations-specific arcana, required a heroic effort from several members of our group, notably Larry Marx and Ed Schnieder, and led to the first publication using MRF by a university group (Kinter et al. 1988).   

If NOAA makes wise, balanced investments, the US will regain the leadership role in numerical weather and climate prediction worldwide. 

Fast forward 30+ years to the current generation of R2O and O2R. Amazingly, the paradigm of the 1980s – special arrangements between groups, heroic efforts to port undocumented code, etc. – were still in force until just a few years ago. However, in 2016, a paradigm shift occurred when NOAA adopted a fresh, unified strategy for modeling. This new way of doing business is a bold experiment to conduct research and development in a truly collaborative way, within the constraints imposed by operational imperatives and marching to the cadence of public releases and operational implementations. The strategy is unified, both because a single modeling platform is envisioned for all forecast applications and because we have formed a single collaborative community to address the scientific, technical and operational challenges. Engaged and willing participants from inside and outside NOAA are thinking strategically about R2O with a 3-5 year vision and 1 to 2-year goals. The Earth Prediction Innovation Center is being conceived to provide the desperately needed O2R community support for codes and workflows to enable experimentation with the operational codes of tomorrow and lower the barriers to R2O transition. 

Moving forward, NOAA has an opportunity to build upon this foundation by making critical investments in scientific research, dedicated high-performance computing for research and development, and software and user support. If NOAA makes wise, balanced investments, the US will regain the leadership role in numerical weather and climate prediction worldwide. 

Jim Kinter


Who's Who

Lindsay Blank

Lindsay Blank joined the DTC as an Associate Scientist in January 2018; this is her first career position in the field after completing school. She grew up in the D.C. area of Maryland, and earned her  B.S. in Meteorology and B.S. in Computer Science at Millersville University in Millersville, Pennsylvania. Her Computer Science degree was added  in her junior year of college after interning at the National Severe Storms Lab in Norman, Oklahoma where she was introduced to numerical weather prediction models. She earned her M.S. in Atmospheric Science from North Carolina State University in Raleigh. 

Lindsay is involved with the Letters to a Pre-Scientist and Skype a Scientist programs, which have honed her ability to “speak science” to youngsters and wider audiences. In her words, she explains her job, I test computer programs that predict the weather and try to make them better so people can be safe and informed.” She is passionate about promoting these volunteer programs as she believes they provide excellent opportunities to engender a love of science in youngsters. 

How did she learn to love science? She wanted to be an architect until the Spring of 2001 when she saw her first tornado. Her dad was driving her and her sister home from a birthday party. Her dad didn't have the radio on so he didn't know that her small town was under a tornado warning. The rain was coming down so hard they could hardly see out of the windshield. When they turned the corner onto the main street, they looked toward the horse field and there was a tornado! “My little sister started crying, my dad grabbed the wheel white-knuckled, but my face was pressed against the window, in awe. Instead of turning around, my dad, a former taxi driver in the Bronx, kept driving. Thankfully, the tornado was moving in the opposite direction. My mom was waiting for us nervously in the driveway. I jumped out of the car talking about how exciting it all was. I asked for my first weather radio that Christmas and decided I wanted to study the weather.”  

Her typical work day mirrors those of many others, starting by checking email and prioritizing her tasks. She works across multiple projects, like most of the DTC staff. Ensuring she’s making the progress expected of her on each one is a balancing act, naturally. Most of her tasks involve validation and verification of different NWPs and their products. She also works on development for the Model Evaluation Tools (MET). Right now, she’s working on validation and verification for the Air Force, leading the development of multivariate MODE functionality, and testing METplus capabilities for sea ice and ocean verification purposes. 

When asked about specific challenges she faces, she answers that it’s the selection of the most appropriate statistic or measure for each validation or verification case. “There are so many statistics and metrics, selecting which ones to use is the most important part of analysis in my opinion; ‘put garbage in, you’ll get garbage out’ as the phrase goes, so I have to decide carefully.” She loves the challenge, however, because it forces her to carefully assess every aspect of the problem at hand, and inspires her to learn more. This aligns with the values that she finds rewarding in her work. Knowing that she’s instrumental in helping to improve the tools operational forecasters use, while providing useful information and tools to model developers and users are the elements that fulfill her. “It means that in some small part, I'm helping to keep people safe.”

One of her favorite quotes is a line from the Walt Whitman poem "Song of Myself." "I exist as I am, that is enough".

Lindsay Blank


Bridges to Operations

CCPP Framework

Contributed by Ligia Bernardet (NOAA/ESRL/GSL) and Mike Ek (NCAR/RAL/JNT)

The Common Community Physics Package (CCPP) is a library of physical parameterizations distributed with a framework that enables its use in any host model that incorporates CCPP into their own structure. CCPP is currently used with NOAA’s Unified Forecast System (UFS) for experimental subseasonal-to-seasonal, medium- and short-range weather, air quality, and hurricane applications, with all physics development for the UFS transitioned to CCPP. The CCPP framework was originally developed by DTC, and is now being co-developed by DTC and NCAR. Both NCAR and the Naval Research Laboratory are adopting CCPP for use in their models. The DTC also distributes the CCPP Single Column Model (SCM), which allows physics experimentation with the CCPP in a simplified setting. The capabilities inherent in the CCPP and its SCM form an optimal collaborative infrastructure for use in a simple-to-more-complex Hierarchical System Development (HSD) approach to test and improve modeling systems, where such an approach can more easily identify systematic biases in models.

The CCPP’s interoperability, specifically, its ability to be used by a wide variety of host models, derives from the method used to communicate variables between the physics and the host models. All variables required by a physical parameterization must be accompanied by metadata, including their standard name, units, rank, etc. Similarly, to be CCPP-compliant, the host models must include metadata about their variables. The CCPP framework compares the variables in the physics against those in the host and automatically generates physics caps, which are software interfaces for communicating variables.

CCPP Architecture

The clearly defined software interfaces for communicating variables facilitate the use and development of the CCPP by the general community, while the interoperability aspects open the door for scientists at multiple organizations using diverse models to share code and work together on physics innovations. Desirable capabilities, such as scheme reordering in a physics suite, grouping schemes (calling one or more parameterizations from different parts of the host model), and subcycling (calling selected schemes at shorter time increments) make the CCPP framework suitable for use in research and operations, streamlining the R2O transition.

The physical parameterizations in the CCPP are typically used as sets by the host models, known as physics suites, and described using Suite Definition Files (SDFs). The CCPP framework permits a multi-suite build, in which multiple SDFs are selected at compile time and are available for use at runtime. This capability is appealing to both researchers and operational centers, since it enables flexibility, while maintaining high computational performance.

The CCPP is in a state of active development. Parameterizations are continuously improved and new schemes and suites are being added to meet the needs of various projects. Collaborative development is stimulated through the use of open-source code accessible via GitHub. Public releases of the CCPP with its SCM can be found at http://dtcenter.org/ccpp and the public release of the UFS Medium-Range Weather Application using CCPP is described at https://github.com/ufs-community/ufs-mrweather-app/wiki.


Visitors

The impacts of including aerosols in the radiance observation operator on analysis using GSI

Visitor: Shih-Wei Wei
Contributed by Shih-Wei Wei, University at Albany, State University of New York

Background 

The Gridpoint Statistical Interpolation (GSI) is a variational data assimilation system (DAS) used by several operational centers. GSI is used by NASA’s Goddard Earth Observing System Model, Version 5 (GEOS-5), as well as NOAA’s Global Forecast System (GFS) and High Resolution Rapid Refresh (HRRR) system. It is also used by the research community for a wide range of applications. The current community version is supported and maintained by the Developmental Testbed Center (DTC; https://dtcenter.org/com-GSI/users/index.php). 

The GSI is able to assimilate observations from conventional and remote sensing instrumentation. For the remote sensing measurements, it provides the functionality to assimilate the retrieval products and the radiances in the form of brightness temperature (BT). To assimilate the radiances directly into GSI, the community radiative transfer model (CRTM) employs the radiance observation operator to calculate the BT of the model state, and uses the adjoint model to translate the first-guess departure of BTs to the analysis fields.  

When using DAS, aerosols are often excluded in the computation of BTs. In reality, aerosols influence the radiative transfer in the atmosphere, including the incoming and outgoing shortwave radiation, and the outgoing terrestrial radiation. The fact that aerosols impact the remote sensing measurements implies that the absence of aerosols in BT simulation may introduce biases into DAS. In the current release of GSI v3.7/CRTM v2.2.6, the functionality to account for the impacts of aerosols on the BT derivation is available. However, it only considers the aerosol species provided by the Goddard Chemistry Aerosol Radiation and Transport (GOCART), which includes five bins for dust, four bins for sea salt, hydrophobic and hydrophilic black and organic carbon, and sulfates.

Planned DTC transition activities

Our visitor project includes two key aspects: (1) add a regression test for the aerosol-enabled radiance observation operator, and (2) investigate the impacts of including aerosols in the radiance observation operator on the analysis fields. Both tasks used the latest master branch of GSI and were conducted on Hera, which is NOAA’s R&D High Performance Computing (HPC) system maintained by the NOAA Environmental Security Computing Center (NESCC)

New regression test

A new regression test (“global_C96_fv3aerorad”) was introduced to ensure the functionality of aerosol-aware BT derivations in GSI/CRTM. This regression test applies the same first-guess files as the regression test for aerosol DA (“global_C96_fv3aero”), which performs the aerosol analysis using satellite aerosol optical depth (AOD) observations on 00Z June 22, 2019. The first-guess files are taken from the aerosol member of the Global Ensemble Forecast System (GEFS-Aerosol v12), which uses the Unified Forecast System FV3 dynamic core coupled with the GOCART aerosol module.  GEFS-Aerosol is slated to replace the current aerosol forecast model by late 2020. The aerosol fields in the first-guess files provide the 3-dimensional multi-speciated aerosol distributions for the BT calculation by CRTM.

Single-cycle GSI experiments

To assess the impact of accounting for aerosols on the GSI analysis, two single-cycle GSI experiments were conducted. These included: (1) the aerosol-blind run (noted as CTL later), which is the baseline GSI, and (2) the aerosol-aware run (noted as AER later), which is the same configuration as the new regression test. 

Figure 1 shows (a) the analyzed temperature difference at 925 hPa between the two experiments, and (b) the total column mass density of the aerosols incorporated into the radiance observation operator. The analyzed temperature differences reveal that when aerosol effects are considered in the derivation of the simulated BT, the air temperatures are adjusted across the globe. The difference in the analyzed temperatures range from -2K to 1K, with the high-latitude regions being the most sensitive to the changes in the simulated BTs. 

Figure 1. (a) Temperature analysis difference at 925 hPa between the AER (aerosol-aware) and the CTL (aerosol-blind) run and (b) the aerosol total column mass density (kg m -2 ). Figures are plotted with Panoply Data Viewer by NASA.

Figure 2 illustrates the impacts on BT after including aerosols in the radiance observation operator. Figure 2a shows the BTs at 10.39 µm from Infrared Atmospheric Sounding Interferometer (IASI) on METOP-A, Figure 2b gives the corresponding BTs simulated in CTL, and Figure 2c shows the simulated BT difference between the two experiments (AER – CTL). The comparison of Figure 2a and 2b show that CTL overestimates BT in several regions, such as the tropical Atlantic Ocean near the Africa coast (~5ºN and 15ºW), the east side of Papua New Guinea, and the Northwest Pacific Ocean near Philippines, and Japan. In these regions, the simulated BTs in AER are cooler than CTL (Figure 2c) which implies a better agreement with the observations. It needs more investigation to address impacts of these aerosol-aware first-guess departures on analysis.

Figure 2d shows the difference in the height of the weighting function peaks between the two experiments (AER – CTL). The peak in the weighting function represents the level that emits most of the radiance received by the sensors. Figure 2d indicates that aerosols affect the level of the peak in the weighting function, which is because the aerosols modify the transmittance profile. The difference in the height of the weighting function remains unchanged for most regions, but can change by as much as 200 hPa in the Antarctic region. This suggests that when considering aerosols in the radiance operator, the different peaks in the weighting function would be generated to the same channel of IASI onboard METOP-A, which will modify the temperature structure in the analysis accordingly.

Figure 2. (a) Observed BT; (b) Simulated BT from the CTL (aerosol-blind); (c) First guess departure difference (AER – CTL) before BC and QC; (d) Difference in the pressure level (hPa) of the peak in weighting function for IASI onboard METOP-A. All the data are from the analysis cycle on 00Z June 22, 2019.

Summary

GSI/CRTM provides the capability of accounting for aerosol effects in the BT derivation. Single-cycle experiments revealed that considering aerosol information in the CRTM radiance operator could introduce cooler simulated BTs, adjustments to the weighting function, and changes to atmospheric temperature analysis. Despite the sensitivities presented in this report, further studies are needed to explore how to incorporate the aerosol information properly through quality control (QC) and bias correction (BC) in DAS. Such efforts are needed to exploit this new option toward enhancing the analysis system and thus, weather forecasting.

Acknowledgment

The author thanks DTC for facilitating this graduate student project, and is very grateful to valuable guidance from Drs. Ming Hu and Guoqing Ge. The author also thanks the input from his academic advisor, Dr. Cheng-Hsuan (Sarah) Lu, and University of Albany colleague, Dr. Dustin Grogan.


Shih-Wei Wei


Community Connections

UFS Users’ Workshop

Contributed by Jeff Beck and Weiwei Li

The first Unified Forecast System (UFS) Users’ Workshop, held on 27-29 July 2020, convened a broad cross-section of the community, despite transitioning from the originally planned in-person format to a virtual format. Organized by a diverse committee from NOAA Global Systems Laboratory (GSL), NOAA Physical Science Laboratory (PSL), NOAA Environmental Modeling Center (EMC), NOAA National Weather Service (NWS), the National Center for Atmospheric Research (NCAR), and George Mason University, the workshop presenters gave one hundred and ten talks to nearly five hundred attendees who registered for the event. While NOAA had a strong presence at the workshop, over 46% of the participants were not affiliated with NOAA, with a strong showing from the academic community (approximately 25%) representing over 44 different academic institutions.  The private sector was the third largest contingent comprising almost 10% of the registrants.  NOAA participants were almost equally split between the NWS and NOAA Research.  The participants and presenters also represented diverse expertise spanning weather, climate, hydrology, oceanography, space weather, modeling and High Performance Computing.  

The workshop kicked off with introductory remarks from Dr. Neil Jacobs, the Assistant Secretary of Commerce for Environmental Observation and Prediction, and an overview of the UFS was presented by the co-leads of the UFS Steering Committee, Dr. Ricky Rood of the University of Michigan and Dr. Hendrik Tolman, the NWS Senior Advisor for Advanced Modeling Systems.  The introductory session was rounded out by presentations by the leads for the six UFS application teams: Medium-Range Weather (MRW) and Subseasonal-to-Seasonal (S2S), Short-Range Weather (SRW), Hurricane, Space Weather, Coastal, and Air Quality.  The remainder of the workshop was a mix of plenary and parallel sessions focused on six topic areas: 

  • UFS Updates, Cloud Computing, Infrastructure, and Computational Performance
  • Model Dynamics, Physics, and Air Quality
  • Data Assimilation, Ensembles, and Predictability
  • Regional Configurations and Extremes: Development and Applications
  • Verification, Evaluation, and Post Processing
  • Earth-System Modeling (Land/Hydrology, Ocean, Sea Ice, Space Weather, Cryosphere)

The participants of the first UFS Users’ Workshop enjoyed lively engagement and discussions, despite the virtual format.  To facilitate exchanges that would normally take place over coffee breaks, lunch, or a reception, the organizing committee set up Slack channels where workshop participants were encouraged to post their questions and comments to the speakers, and dialogue was encouraged to continue on this platform following each presentation.  Each general topic area was issued a Slack channel to aid in navigating this communication forum and foster dialogue during the parallel sessions.  

Find Out More About UFS

Slack, a channel-based messaging platform, used for the first UFS Users’ Workshop to aid in navigating this communication forum and foster dialogue during the parallel sessions.


Did you know?

Community Workflow for the Limited Area Model Version of the FV3

Contributed by Jeff Beck and Gerard Ketefian

A workflow enabling users to run the atmospheric component of the Unified Forecast System
regional configuration (FV3-LAM) in an end-to-end capacity will soon be available to the broader
community. This community workflow is the result of a coordinated effort between EMC, GSL,
and DTC. Components of the workflow include experiment generation, Rocoto XML file
generation, and the scripts necessary to run pre-processing, model integration, and post-
processing. Collaboration across multiple labs fostered the development of a user-friendly,
modular system, allowing users to run their experiments in either a research/community mode
or in an NCEP Central Operations (NCO)-compliant environment, reproducing variable names
and directory structures used in operations at NCEP. Multiple computing platforms, external
model data sources, and CCPP physics suites are supported, with pre-defined domains already
provided for the user to choose from. The option to create a user-defined domain is also
available. The ultimate goal of the FV3-LAM community workflow is to support the general
research community, as well as facilitating research-to-operations by offering developers the
opportunity to test innovations within an NCO experiment environment to ease operational
transitions of model code at NCEP.

CONUS domain set up to run with the regional workflow


PROUD Awards

HOWARD SOH, Software Engineer III, NSF NCAR RAL & DTC |

Howard Soh is a Software Engineer III with the NSF NCAR Research Applications Laboratory who contributes to the development and support of the Model Evaluation Tools (MET) statistical component of the METplus system at the DTC.

Howard splits his time between the National Security Applications Program (NSAP) and the Joint Numerical Testbed (JNT), but his contributions to METplus far exceed expectations for that allocation. He is a fully engaged and active member of the METplus team and is a leader in several critical aspects of MET: SonarQube static code analysis, Python embedding, NetCDF APIs, point observation data ingest, and adding support for unstructured grids. Howard also monitors the METplus Discussions forum, where users submit questions for help, and provides his expertise when needed. He often answers the questions via email or Slack well before the person monitoring Discussions for that day has even read the question!

The DTC is proud to recognize Howard for consistently demonstrating excellent technical ability, initiative, communication, and leadership skills with all of his team members. He is not only a talented software engineer on the METplus team, but is also eager to lead new development tasks, takes a proactive approach in supporting customers, is friendly and approachable, and is always happy to help the team.

Thank you, Howard, for all the work you do for your DTC colleagues, partners, and customers!

,