Implementing the GFS global model with the FV3 dynamic core upgrade into the National Centers for Environmental Prediction (NCEP) Production Suite will be the first step towards a Unified Forecast System (UFS). But prior to any new code being delivered to NCEP Central Operations, the NCEP Director must decide whether the implementation should occur, based on recommendations from the Environmental Modeling Center (EMC) and customers and stakeholders in the field at the conclusion of a formal evaluation period. EMC’s Model Evaluation Group (MEG) is part of the Verification, Post Processing, and Product Generation Branch in EMC and provides independent validation of new or revised models. To assist the field in making their recommendations on a new model or major upgrade, the MEG is tasked with providing information on the model and its performance through webinars and online material, and then making its own formal recommendation.
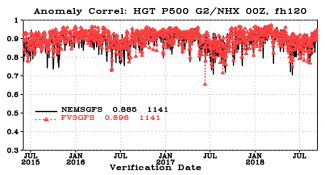
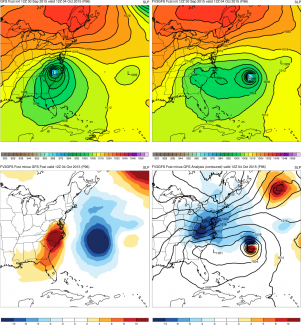
As the cornerstone of the five-month evaluation period, the MEG created a single, central location web site where users could view data, obtain files, get detailed information about the model, and see statistics from both the real-time parallel testing and three years of retrospective runs. The MEG devoted eleven of its weekly webinars to discussions on expectations for the evaluation. This included issues with new products, resolution of problems seen in the parallel output, statistical and subjective assessment of model performance on standard performance metrics, and high-impact cases involving hurricanes, winter storms, major rainfall, severe weather, and extreme hot and cold temperatures. The collaboration with partners across the weather enterprise to evaluate the GFS with the FV3 core was unprecedented in terms of comprehensiveness and scope. Implementation of the GFS with the FV3 upgrade is currently scheduled for January 2019.

